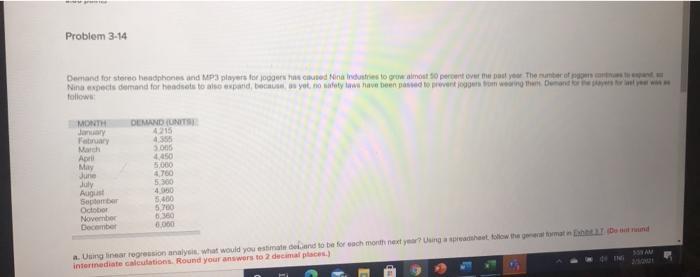
se prom Problem 3-14 Demand for stereo headphones and MP3 players for joggers has caused Nina Industries to grow almost 50 percent over the


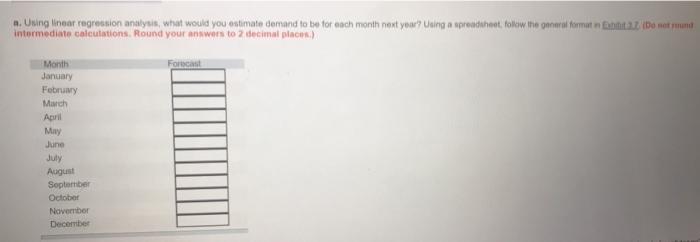
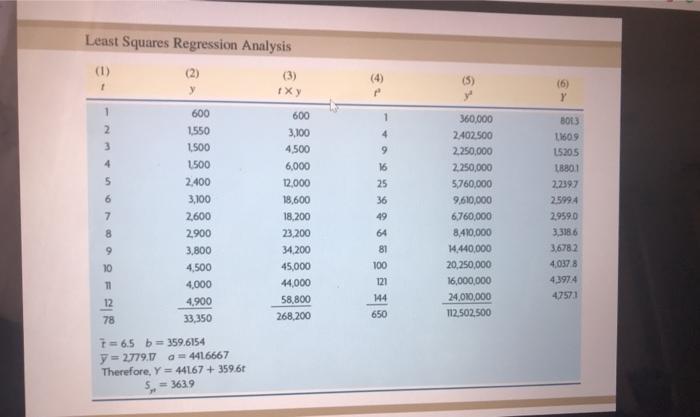
se prom Problem 3-14 Demand for stereo headphones and MP3 players for joggers has caused Nina Industries to grow almost 50 percent over the past year. The number of persons to expand Nina expects demand for headsets to also expand, because, as yet, no safety laws have been passed to prevent joggers from wearing them Demand for the payers for a year w follows: MONTH January February March April May Junie July August September October November December DEMAND (UNITS) 4215 4.355 3.005 4,450 5,000 4,760 5.300 4,960 5,400 5,700 6,360 4,000 55 AM 201 a. Using linear regression analysis, what would you estimate delend to be for each month next year? Using a spreadsheet, follow the general format in Exh7 (Do it rund intermediate calculations. Round your answers to 2 decimal places.) de ING a. Using linear regression analysis, what would you estimate demand to be for each month next year? Using a spreadsheet, follow the general format in Exhibit 3.7. (Do not found intermediate calculations. Round your answers to 2 decimal places.) Month January February Marich April May June July August September October November December Forecast b. To be reasonably confident of meeting demand, Nina decides to use 3 standard errors of estimate for safety How many additional units should be held to meet the level of contidence? (Do not round intermediate calculations. Round your answer to the nearest whole number) Additional units Least Squares Regression Analysis (1) (2) t y 1 2 3 4 5 6 7 8 9 10 11 12 78 600 1,550 1,500 1500 2,400 3,100 2,600 2,900 3,800 4,500 4,000 4,900 33,350 7-6.5 b=359.6154 y=2779.17 a=4416667 Therefore, Y=44167+359.6t 5,- =363.9 IXy 600 3,100 4,500 6,000 12,000 18,600 18,200 23,200 34,200 45,000 44,000 58,800 268,200 9 16 25 36 49 64 81 100 121 144 650 360,000 2,402.500 2,250,000 2,250,000 5,760,000 9,610,000 6,760,000 8,410,000 14,440,000 20,250,000 16,000,000 24,010,000 112,502,500 (6) Y 8013 11609 1530.5 18801 2,2397 2.5994 2,959.0 3,318.6 3,678.2 4,037.8 4.397.4 47573
Step by Step Solution
3.58 Rating (151 Votes )
There are 3 Steps involved in it
Step: 1
linear regression analysis forecasting a step 1 Find a trend line y ...
See step-by-step solutions with expert insights and AI powered tools for academic success
Step: 2

Step: 3

Ace Your Homework with AI
Get the answers you need in no time with our AI-driven, step-by-step assistance
Get Started


