Answered step by step
Verified Expert Solution
Link Copied!

Question

1 Approved Answer

Accounting project 201! Tesla II. Instructions for Ratio Analysis Assignment (Excel) Click on the sheet named Ratios. (your company workbook downloaded from Canvas) Use the

Accounting project 201! Tesla

II. Instructions for Ratio Analysis Assignment (Excel)

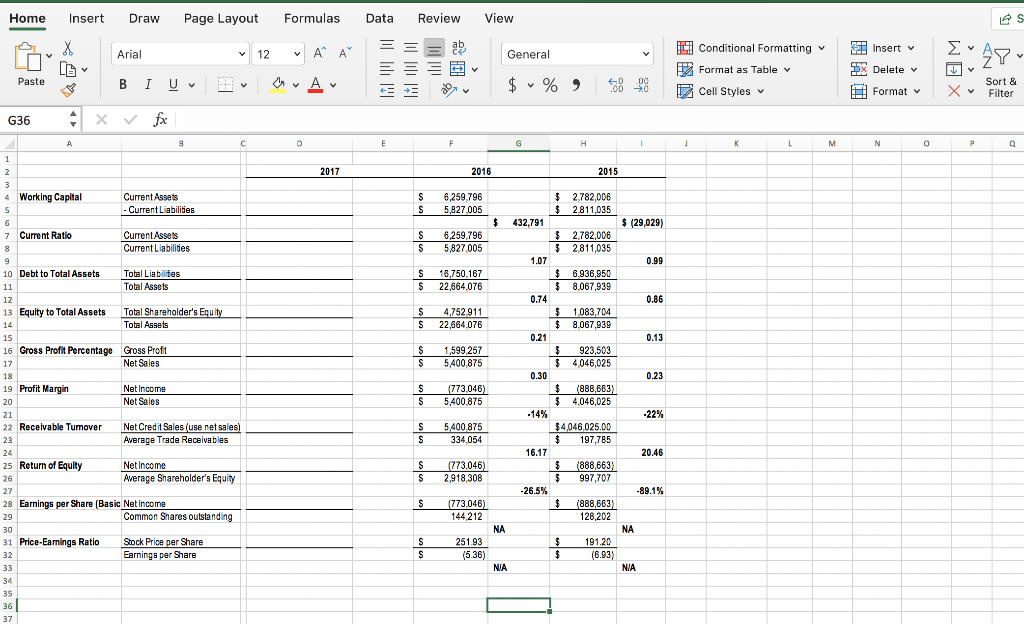
Click on the sheet named Ratios. (your company workbook downloaded from Canvas) Use the cell referencing commands to carry the amounts over to the sheet named Ratios. Analysis of some ratios can be compared more easily across its own industry. Each ratio should be calculated using the proper format and style. They should be computed using formulas in Excel, not a calculator.

Liquidity Ratios

Current Ratio Current Assets

Current Liabilities

Companies want their current ratio to be higher than 1. It measures the ability to pay current liabilities with current assets.

Working Capital Current Assets - Current Liabilities

Companies want a positive number. Measures the ability of a company to pay its debts if needed.

Leverage and Solvency

Debt to Total Assets Total Liabilities

Total Assets

Measures the percentage of assets that are financed by creditors. Less than 60% is good. The greater the amount of debt, the riskier the company.

Equity to Total Assets Total Shareholders Equity

Total Assets

Measures the percentage of assets financed by stockholders. Between 40% and 60% is good.

Profitability

Gross Profit Percentage Gross Profit

Net Sales

Measures the percentage of profit that is derived from the sale of goods.

Profit Margin Net Income

Net Sales

Measures the amount of profit from each dollar of sales after all operating expenses.

Management of Working Capital

Receivable Turnover Sales

Average Accounts Receivables

Measures the amount of days it takes for a company to turn over its accounts receivable. Average = 12.0.

Return of Equity Net Income

Average Shareholders Equity

Measures the income earned on each dollar of investment by stockholders.

Earnings per Share Net Income

Common Shares outstanding

Measures the Net Income earned on each share of Common Stock.

Price-Earnings Ratio Stock Price per Share **

Earnings per Share

Measures the investors assessment of a companys future earnings.

**Go to NASDAQ.com to get the year end stock price at the close of the day.

image text in transcribed

Home Insert Draw Page Layout Formulas Data Review View Conditional Formattingnsert v Arial General Format as Table x Delete $ v % , Paste Sort & Cell Styles v Format v G36 2017 2,782,006 2811,035 4 Working Capital Current Assets Criabilities CurrentAssets Current Liabilies Total Liabifes Total Assets S 6259,796 S 5827.005 432,791 (29,029) 7 Current Ratio 6259,796 S 5,827,005 52.782,006 2,811,035 1.07 0.99 $6936,950 58,067,939 Debt to Total Assets S 18,750,167 S 22,664,076 10 12 0.74 0.86 Equity to Total AssetsTotal Shareholder's Equ S 4,752911 S 22864.076 1,083,704 $ 8.067939 13 Total Assets 15 0.21 16 Gross Profit Percentage Gross Proft 1599257 $ 5400,875 5923,503 54,046,025 Net Sales 0.30 0.23 3.046 S 5400,875 $(888,663 4,046,025 19 Profit Margin Net Income Net Sales 14% 22 Receivable Tumover Net Credit Sales (use netsales S 5,400.875 34.054 4046,025.00 $197,785 Average Trade Receivables 16.17 20.46 5 Return of Equity Net Income Average Shareholder's Equity 3,046 S 2918,308 5997,707 26.5% -89.1% 046 144.212 Earnings per Share (Basic Net ncome 28 29 (888,663 128,202 Common Shares outstanding NA 1 Price-Earnings Rato 32 Stock Price per Share Earnings per Share 191.20 6.93 5.36 36 Home Insert Draw Page Layout Formulas Data Review View Conditional Formattingnsert v Arial General Format as Table x Delete $ v % , Paste Sort & Cell Styles v Format v G36 2017 2,782,006 2811,035 4 Working Capital Current Assets Criabilities CurrentAssets Current Liabilies Total Liabifes Total Assets S 6259,796 S 5827.005 432,791 (29,029) 7 Current Ratio 6259,796 S 5,827,005 52.782,006 2,811,035 1.07 0.99 $6936,950 58,067,939 Debt to Total Assets S 18,750,167 S 22,664,076 10 12 0.74 0.86 Equity to Total AssetsTotal Shareholder's Equ S 4,752911 S 22864.076 1,083,704 $ 8.067939 13 Total Assets 15 0.21 16 Gross Profit Percentage Gross Proft 1599257 $ 5400,875 5923,503 54,046,025 Net Sales 0.30 0.23 3.046 S 5400,875 $(888,663 4,046,025 19 Profit Margin Net Income Net Sales 14% 22 Receivable Tumover Net Credit Sales (use netsales S 5,400.875 34.054 4046,025.00 $197,785 Average Trade Receivables 16.17 20.46 5 Return of Equity Net Income Average Shareholder's Equity 3,046 S 2918,308 5997,707 26.5% -89.1% 046 144.212 Earnings per Share (Basic Net ncome 28 29 (888,663 128,202 Common Shares outstanding NA 1 Price-Earnings Rato 32 Stock Price per Share Earnings per Share 191.20 6.93 5.36 36

Step by Step Solution

There are 3 Steps involved in it

Step: 1

blur-text-image

Get Instant Access to Expert-Tailored Solutions

See step-by-step solutions with expert insights and AI powered tools for academic success

Step: 2

blur-text-image

Step: 3

blur-text-image

Ace Your Homework with AI

Get the answers you need in no time with our AI-driven, step-by-step assistance

Get Started

Recommended Textbook for

Dynamic Data Sharing For Public Data Integrity Auditing In The Cloud

Authors: B Gunalan

1st Edition

050911878X, 978-0509118789

More Books

Students also viewed these Accounting questions

Question

Describe the patterns of business communication.

Answered: 1 week ago

Question

3. Provide two explanations for the effects of mass media

Answered: 1 week ago