The figure shows the rate of change in the average plasma concentration of the drug Omeprazole (in ng/ml per hour) for six hours after


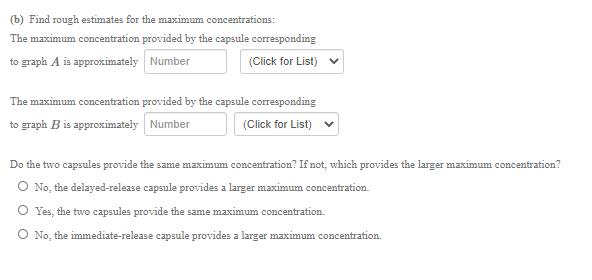
The figure shows the rate of change in the average plasma concentration of the drug Omeprazole (in ng/ml per hour) for six hours after the first dose is administered using two different capsules: immediate-release and delayed-release". (a) Which graph corresponds to which capsule? The graph for the immediate-release capsule corresponds to Graph AO Graph B The graph for the delayed-release capsule corresponds to O Graph A Graph B (b) Find rough estimates for the maximum concentrations: The maximum concentration provided by the capsule corresponding to graph A is approximately Number (Click for List) rate (ng/mL per hour) 3000 2000 A 1000 -1000 F B 3 4 5 6 t (hours) (b) Find rough estimates for the maximum concentrations: The maximum concentration provided by the capsule corresponding to graph A is approximately Number (Click for List) The maximum concentration provided by the capsule corresponding to graph B is approximately Number (Click for List) Do the two capsules provide the same maximum concentration? If not, which provides the larger maximum concentration? O No, the delayed-release capsule provides a larger maximum concentration O Yes, the two capsules provide the same maximum concentration. O No, the immediate-release capsule provides a larger maximum concentration.
Step by Step Solution
3.46 Rating (172 Votes )
There are 3 Steps involved in it
Step: 1
Summarized answer a The graph of immediate release capsule is Graph A due to sudden rise in concentration with time The graph for the delayed release capsule is Graph Bdue to delay in time with peak b ...
See step-by-step solutions with expert insights and AI powered tools for academic success
Step: 2

Step: 3

Ace Your Homework with AI
Get the answers you need in no time with our AI-driven, step-by-step assistance
Get Started


