

Question
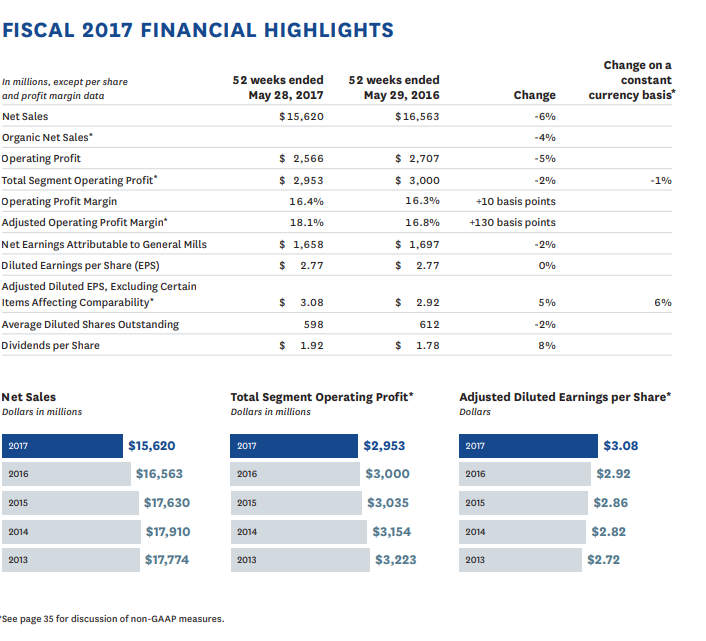
Accounting Research Problem: General Mills, Inc. The fiscal year 2017 annual report of Gen- eral Mills, Inc. is available on this books web site. Required
Accounting Research Problem: General Mills, Inc. The fiscal year 2017 annual report of Gen-
eral Mills, Inc. is available on this books web site.
Required
a. Calculate (or identify) the following financial ratios for 2016 and 2017:
1. Gross profit percentage
2. Return on sales
3. Asset turnover (2015, total assets 5 $21,832.0 million)
4. Return on assets (2015, total assets 5 $21,832.0 million)
5. Return on common stockholders equity (2015, total stockholders equity 5
$4,996.7 million)
6. Current ratio
7. Quick ratio
8. Operating-cash-flow-to-current-liabilities ratio (2015, current liabilities 5 $4,890.1
million)
9. Accounts receivable turnover (2015, accounts receivable 5 $1,386.7 million)
10. Average collection period
11. Inventory turnover (2015, inventory 5 $1,540.9 million)
12. Days sales in inventory
13. Debt-to-equity ratio
14. Times-interest-earned ratio
15. Operating-cash-flow-to-capital-expenditures ratio
16. Earnings per share
17. Price-earnings ratio (Use year-end adjusted closing stock price of $57.32 for 2017 and
$63.69 for 2016.)
18. Dividend yield
19. Dividend payout ratio
b. Comment briefly on the changes from fiscal 2016 to fiscal 2017 in the ratios computed above.
Fiscal Year Report:
Step by Step Solution
There are 3 Steps involved in it
Step: 1

Get Instant Access to Expert-Tailored Solutions
See step-by-step solutions with expert insights and AI powered tools for academic success
Step: 2

Step: 3
Ace Your Homework with AI
Get the answers you need in no time with our AI-driven, step-by-step assistance
Get Started
External Auditing Tutorial
Authors: Jo Osborne, John Taylor
1st Edition
9781909173965, 1909173967