Answered step by step
Verified Expert Solution
Question
1 Approved Answer
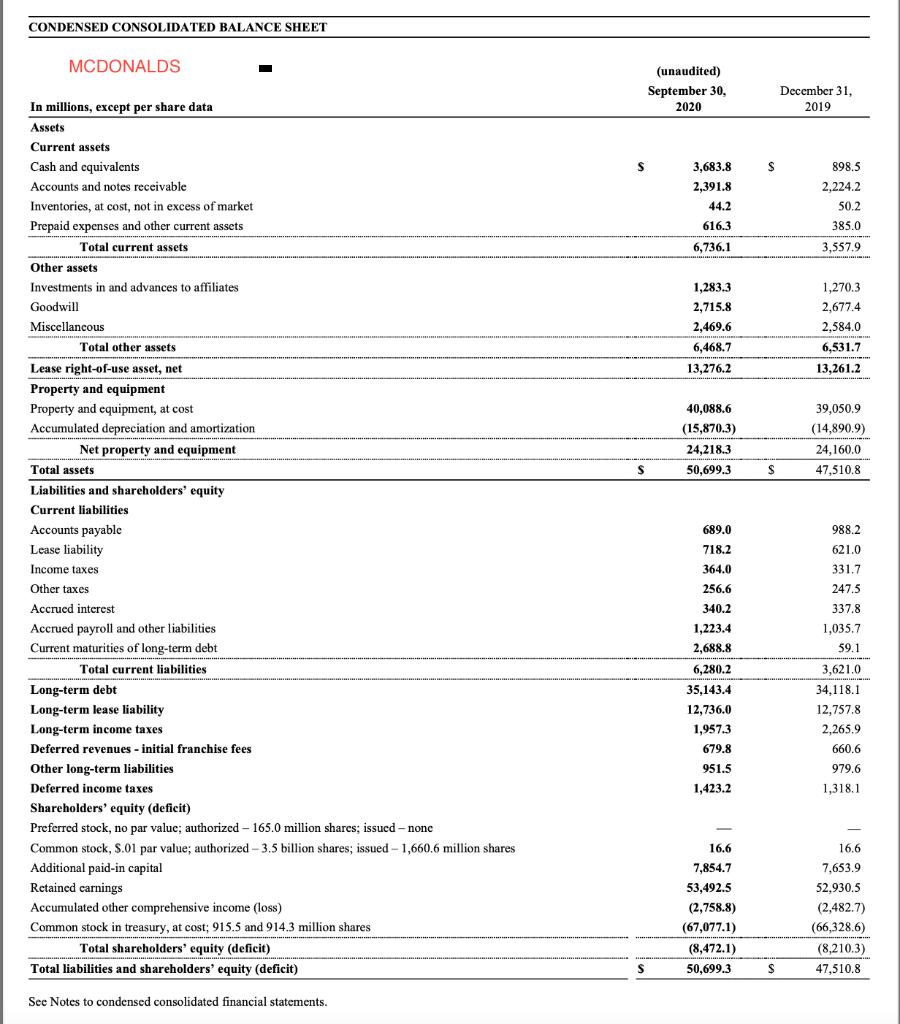
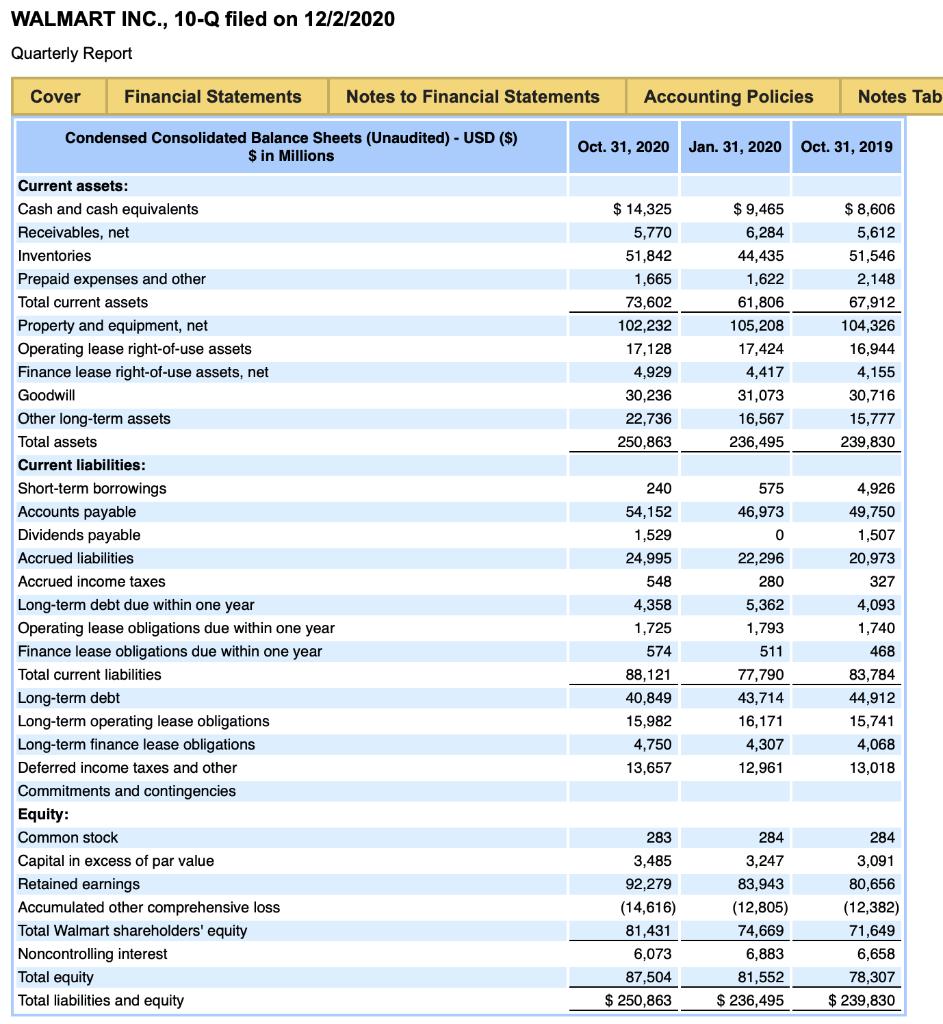
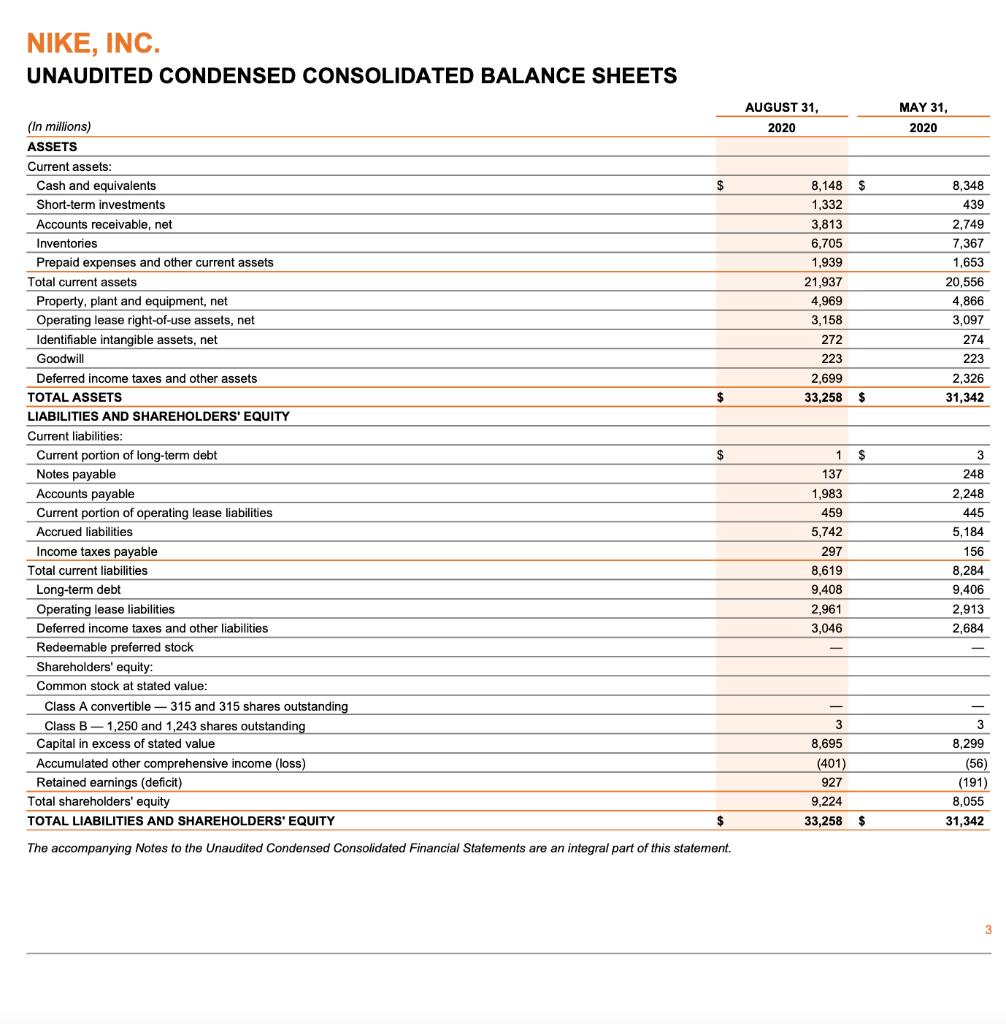
Use horizontal analysis to compare each the given year on the balance sheet. Quantify both the changes of a few assets, liabilities and equity categories
Use horizontal analysis to compare each the given year on the balance sheet. Quantify both the changes of a few assets, liabilities and equity categories (i.e. current assets, long term liabilities, etc.) along with the change in the ratios you have chosen. Don’t compare different companies to each other at this point.
What were the changes since the last year?
Which companies improved and which worsened?


 Use your understanding of financial ratios to explain how you know if a company improved or worsened.
CONDENSED CONSOLIDATED BALANCE SHEET MCDONALDS In millions, except per share data Assets Current assets Cash and equivalents Accounts and notes receivable Inventories, at cost, not in excess of market Prepaid expenses and other current assets Total current assets. Other assets Investments in and advances to affiliates Goodwill Miscellaneous Total other assets Lease right-of-use asset, net Property and equipment Property and equipment, at cost Accumulated depreciation and amortization Net property and equipment Total assets Liabilities and shareholders' equity Current liabilities Accounts payable Lease liability Income taxes Other taxes Accrued interest Accrued payroll and other liabilities Current maturities of long-term debt Total current liabilities Long-term debt Long-term lease liability Long-term income taxes. Deferred revenues - initial franchise fees Other long-term liabilities Deferred income taxes Shareholders' equity (deficit) Preferred stock, no par value; authorized - 165.0 million shares; issued - none Common stock, $.01 par value; authorized - 3.5 billion shares; issued-1,660.6 million shares Additional paid-in capital Retained earnings Accumulated other comprehensive income (loss) Common stock in treasury, at cost; 915.5 and 914.3 million shares Total shareholders' equity (deficit) Total liabilities and shareholders' equity (deficit) See Notes to condensed consolidated financial statements. S S S (unaudited) September 30, 2020 3,683.8 2,391.8 44.2 616.3 6,736.1 1,283.3 2,715.8 2,469.6 6,468.7 13,276.2 40,088.6 (15,870.3) 24,218.3 50,699.3 689.0 718.2 364.0 256.6 340.2 1,223.4 2,688.8 6,280.2 35,143.4 12,736.0 1,957.3 679.8 951.5 1,423.2 16.6 7,854.7 53,492.5 (2,758.8) (67,077.1) (8,472.1) 50,699.3 $ $ S December 31, 2019 898.5 2,224.2 50.2 385.0 3,557.9 1,270.3 2,677.4 2,584.0 6,531.7 13,261.2 39,050.9 (14,890.9) 24,160.0 47,510.8 988.2 621.0 331.7 247.5 337.8 1,035.7 59.1 3,621.0 34,118.1 12,757.8 2,265.9 660.6 979.6 1,318.1 16.6 7,653.9 52,930.5 (2,482.7) (66,328.6) (8,210.3) 47,510.8
Step by Step Solution
★★★★★
3.48 Rating (165 Votes )
There are 3 Steps involved in it
Step: 1
Mc Donald s Compar ison of 2020 to 2019 Current Assets Increase of 1 178 2 million 17 2 Current Li a...
Get Instant Access to Expert-Tailored Solutions
See step-by-step solutions with expert insights and AI powered tools for academic success
Step: 2

Step: 3

Ace Your Homework with AI
Get the answers you need in no time with our AI-driven, step-by-step assistance
Get Started


