Question: Use the following data to construct balance sheets for Jones Company for the past 3 years. Construct the statements using the raw numbers, common-sized,


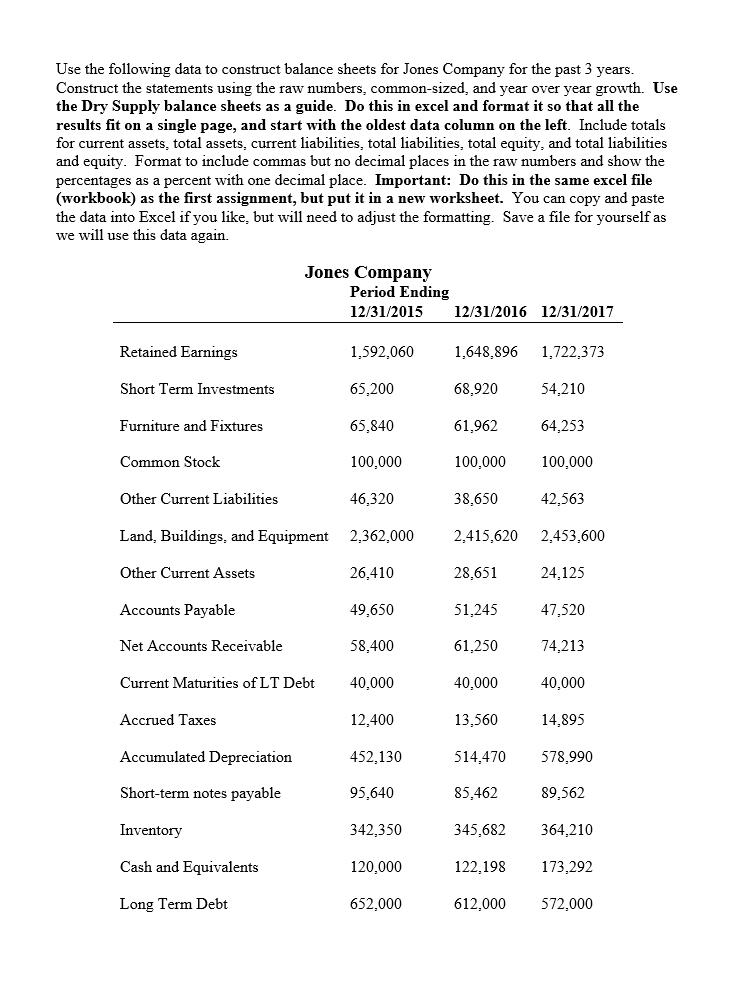
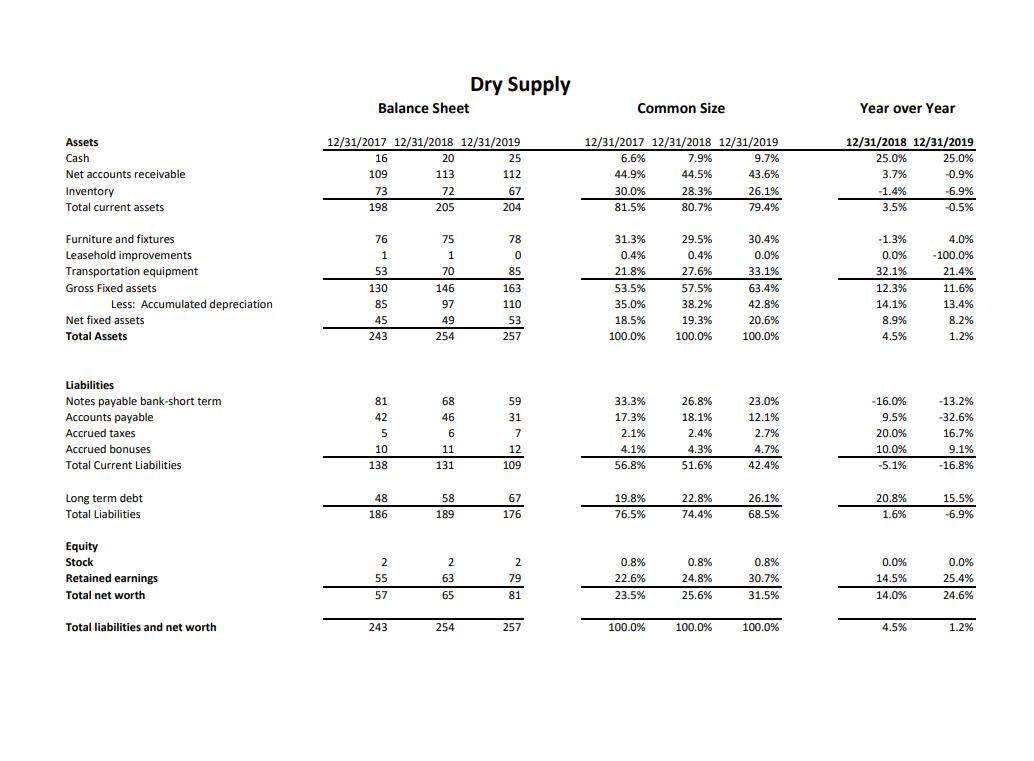
Use the following data to construct balance sheets for Jones Company for the past 3 years. Construct the statements using the raw numbers, common-sized, and year over year growth. Use the Dry Supply balance sheets as a guide. Do this in excel and format it so that all the results fit on a single page, and start with the oldest data column on the left. Include totals for current assets, total assets, current liabilities, total liabilities, total equity, and total liabilities and equity. Format to include commas but no decimal places in the raw numbers and show the percentages as a percent with one decimal place. Important: Do this in the same excel file (workbook) as the first assignment, but put it in a new worksheet. You can copy and paste the data into Excel if you like, but will need to adjust the formatting. Save a file for yourself as we will use this data again. Jones Company Period Ending 12/31/2015 12/31/2016 12/31/2017 Retained Earnings 1,592,060 1,648,896 1,722,373 Short Term Investments 65,200 68,920 54,210 Furniture and Fixtures 65,840 61,962 64,253 Common Stock 100,00 Other Current Liabilities 38,650 42,563 Land, Buildings, and Equipment 2,415,620 2,453,600 Other Current Assets 28,651 24,125 Accounts Payable 51,245 47,520 Net Accounts Receivable 61,250 74,213 Current Maturities of LT Debt 40,000 40,000 Accrued Taxes 13,560 14,895 Accumulated Depreciation 514,470 578,990 Short-term notes payable 85,462 89,562 Inventory 345,682 364,210 Cash and Equivalents 122,198 173,292 Long Term Debt 612,000 572,000 0,000 46,320 2,362,000 26,410 49,650 58,400 40,000 12,400 452,130 95,640 342,350 120,000 652,000 0,000 Assets Cash Net accounts receivable Inventory Total current assets. Furniture and fixtures Leasehold improvements Transportation equipment Gross Fixed assets Net fixed assets Total Assets Liabilities Notes payable bank-short term. Accounts payable Accrued taxes Accrued bonuses Total Current Liabilities Long term debt Total Liabilities Equity Stock Retained earnings Total net worth Total liabilities and net worth Less: Accumulated depreciation Balance Sheet 12/31/2017 12/31/2018 12/31/2019 16 20 25 113 112 109 73 198 72 67 205 204 76 75 78 1 0 53 85 130 163 85 110 45 53 243 257 59 31 7 81 42 5 10 138 48 186 2 55 57 243 1 70 146 97 49 254 68 46 6 11 131 58 Dry Supply 189 2 63 65 254 12 109 67 176 2 79 81 257 Common Size 12/31/2017 12/31/2018 12/31/2019. 9.7% 6.6% 44.9% 7.9% 44.5% 43.6% 30.0% 28.3% 26.1% 81.5% 80.7% 79.4% 31.3% 29.5% 30.4% 0.4% 0.4% 0.0% 21.8% 27.6% 33.1% 53.5% 57.5% 63.4% 35.0% 38.2% 42.8% 18.5% 19.3% 20.6% 100.0% 100.0% 100.0% 33.3% 26.8% 23.0% 17.3% 18.1% 12.1% 2.1% 2.4% 2.7% 4.1% 4.3% 4.7% 56.8% 51.6% 42.4% 19.8% 22.8% 26.1% 76.5% 74.4% 68.5% 0.8% 0.8% 0.8% 22.6% 24.8% 30.7% 23.5% 25.6% 31.5% 100.0% 100.0% 100.0% Year over Year 12/31/2018 12/31/2019 25.0% 25.0% 3.7% -0.9% -1.4% -6.9% 3.5% -0.5% -1.3% 0.0% 4.0% -100.0% 21.4% 32.1% 12.3% 11.6% 14.1% 13.4% 8.9% 8.2% 4.5% 1.2% -16.0% -13.2% 9.5% -32.6% 20.0% 16.7% 10.0% 9.1% -5.1% -16.8% 20.8% 15.5% 1.6% -6.9% 0.0% 0.0% 14.5% 25.4% 14.0% 24.6% 4.5% 1.2%
Step by Step Solution
3.42 Rating (155 Votes )
There are 3 Steps involved in it
Jones Company Particulars Balance Sheet Common Size Year over Year 12312015 12312016 12312017 123120... View full answer

Get step-by-step solutions from verified subject matter experts


