Answered step by step
Verified Expert Solution
Question
1 Approved Answer
You are a team of marketing executives that work for UCC Company. UCC Company has been selling its industrial clothing across Canada for over


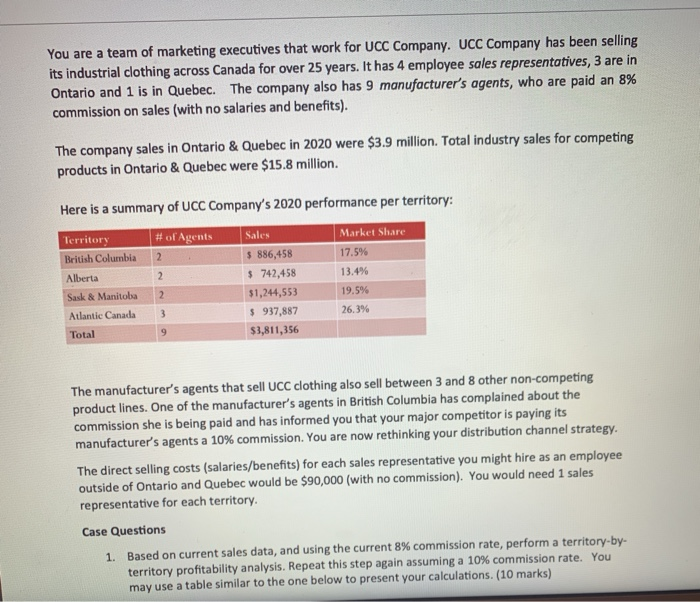
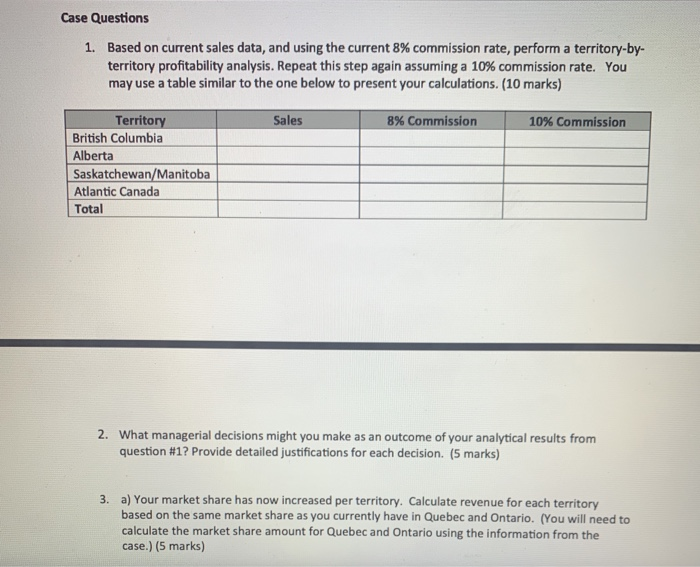
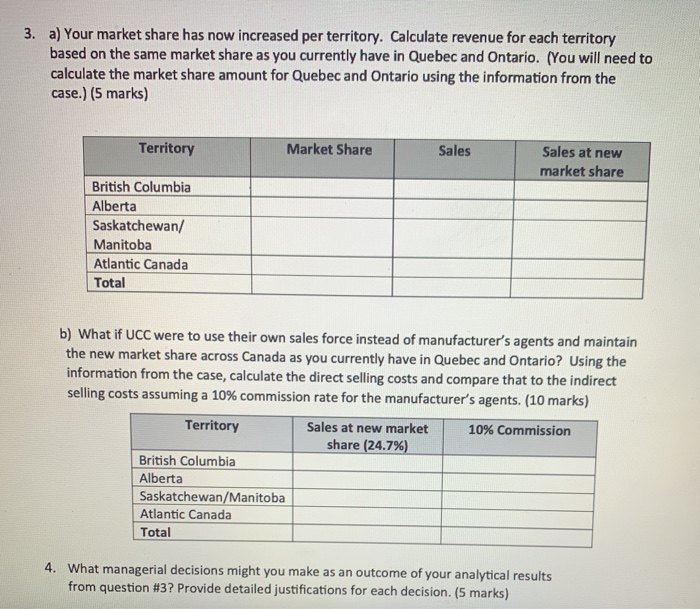
You are a team of marketing executives that work for UCC Company. UCC Company has been selling its industrial clothing across Canada for over 25 years. It has 4 employee sales representatives, 3 are in Ontario and 1 is in Quebec. The company also has 9 manufacturer's agents, who are paid an 8% commission on sales (with no salaries and benefits). The company sales in Ontario & Quebec in 2020 were $3.9 million. Total industry sales for competing products in Ontario & Quebec were $15.8 million. Here is a summary of UCC Company's 2020 performance per territory: # of Agents Market Share 17.5% 13.4% 19.5% 26.3% Territory British Columbia Alberta Sask & Manitoba Atlantic Canada Total 2 2 3 9 Sales $ 886,458 $ 742,458 $1,244,553 $ 937,887 $3,811,356 The manufacturer's agents that sell UCC clothing also sell between 3 and 8 other non-competing product lines. One of the manufacturer's agents in British Columbia has complained about the commission she is being paid and has informed you that your major competitor is paying its manufacturer's agents a 10 % commission. You are now rethinking your distribution channel strategy. The direct selling costs (salaries/benefits) for each sales representative you might hire as an employee outside of Ontario and Quebec would be $90,000 (with no commission). You would need 1 sales representative for each territory. Case Questions 1. Based on current sales data, and using the current 8 % commission rate, perform a territory-by- territory profitability analysis. Repeat this step again assuming a 10 % commission rate. You may use a table similar to the one below to present your calculations. (10 marks) Case Questions 1. Based on current sales data, and using the current 8% commission rate, perform a territory-by- territory profitability analysis. Repeat this step again assuming a 10% commission rate. You may use a table similar to the one below to present your calculations. (10 marks) Sales Territory British Columbia Alberta Saskatchewan/Manitoba Atlantic Canada Total 8% Commission 10% Commission 2. What managerial decisions might you make as an outcome of your analytical results from question #1? Provide detailed justifications for each decision. (5 marks) 3. a) Your market share has now increased per territory. Calculate revenue for each territory based on the same market share as you currently have in Quebec and Ontario. (You will need to calculate the market share amount for Quebec and Ontario using the information from the case.) (5 marks) 3. a) Your market share has now increased per territory. Calculate revenue for each territory based on the same market share as you currently have in Quebec and Ontario. (You will need to calculate the market share amount for Quebec and Ontario using the information from the case.) (5 marks) Territory British Columbia Alberta Saskatchewan/ Manitoba Atlantic Canada Total British Columbia Alberta Market Share Saskatchewan/Manitoba Atlantic Canada Total b) What if UCC were to use their own sales force instead of manufacturer's agents and maintain the new market share across Canada as you currently have in Quebec and Ontario? Using the information from the case, calculate the direct selling costs and compare that to the indirect selling costs assuming a 10% commission rate for the manufacturer's agents. (10 marks) Territory 10% Commission Sales Sales at new market share (24.7%) Sales at new market share 4. What managerial decisions might you make as an outcome of your analytical results from question # 3? Provide detailed justifications for each decision. (5 marks).
Step by Step Solution
★★★★★
3.57 Rating (147 Votes )
There are 3 Steps involved in it
Step: 1
1 Sales Performance 2020 with 8 commission Rate outside Ontario Quebec Sales of Ma...
Get Instant Access to Expert-Tailored Solutions
See step-by-step solutions with expert insights and AI powered tools for academic success
Step: 2

Step: 3

Ace Your Homework with AI
Get the answers you need in no time with our AI-driven, step-by-step assistance
Get Started


