Acertain deck of cards has cards that show one of ve different shapes with equal representation, so that the probability of selecting any particular shape
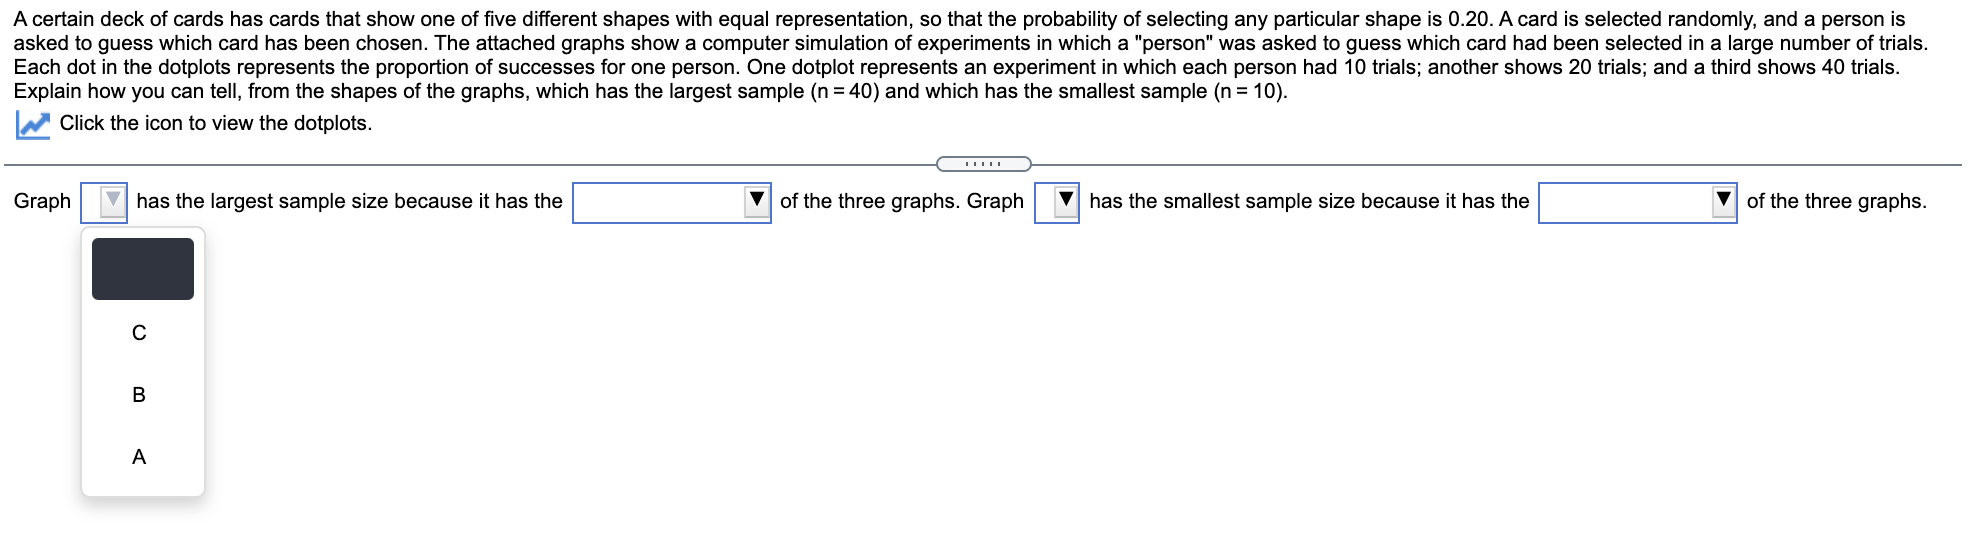
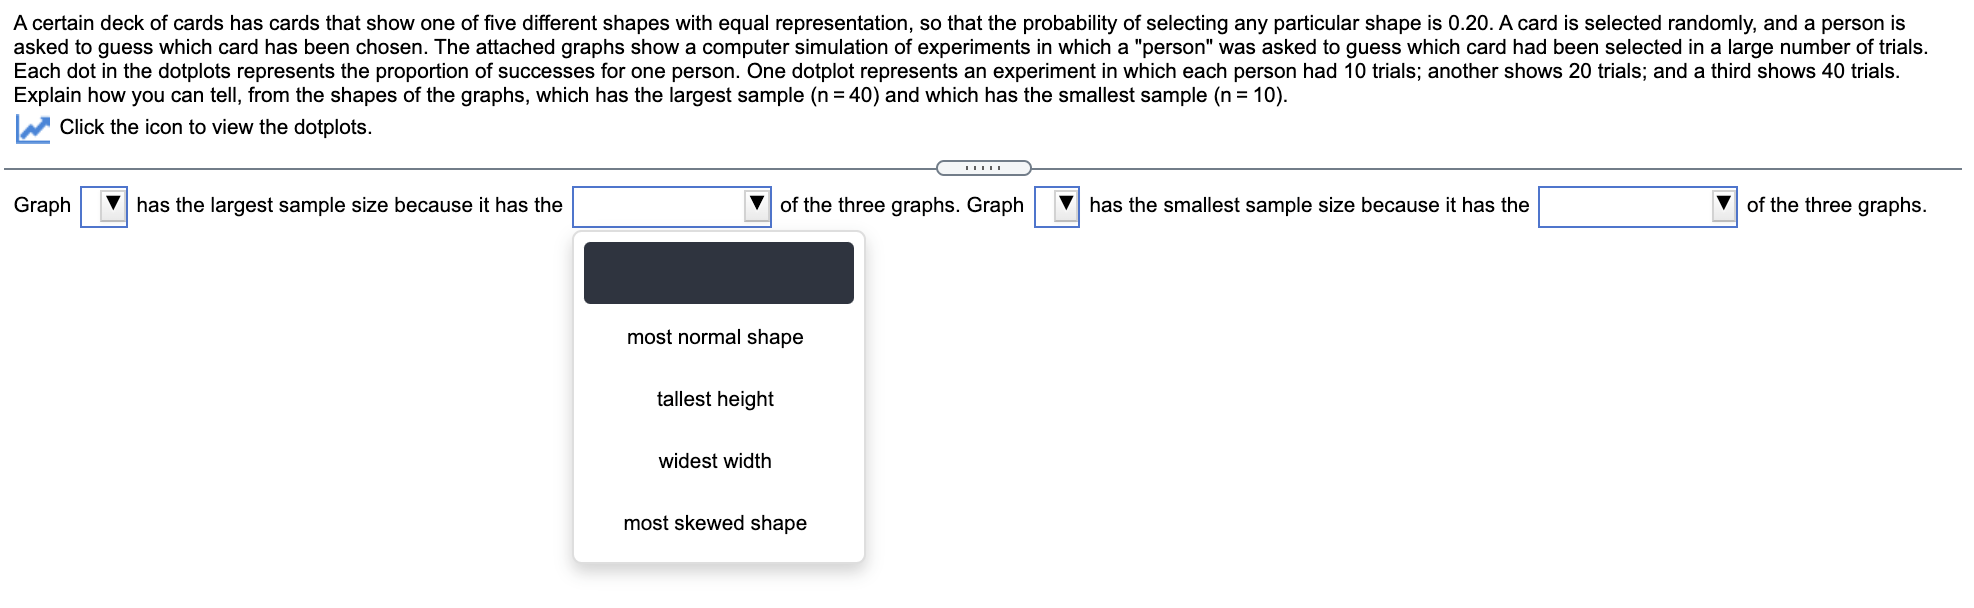
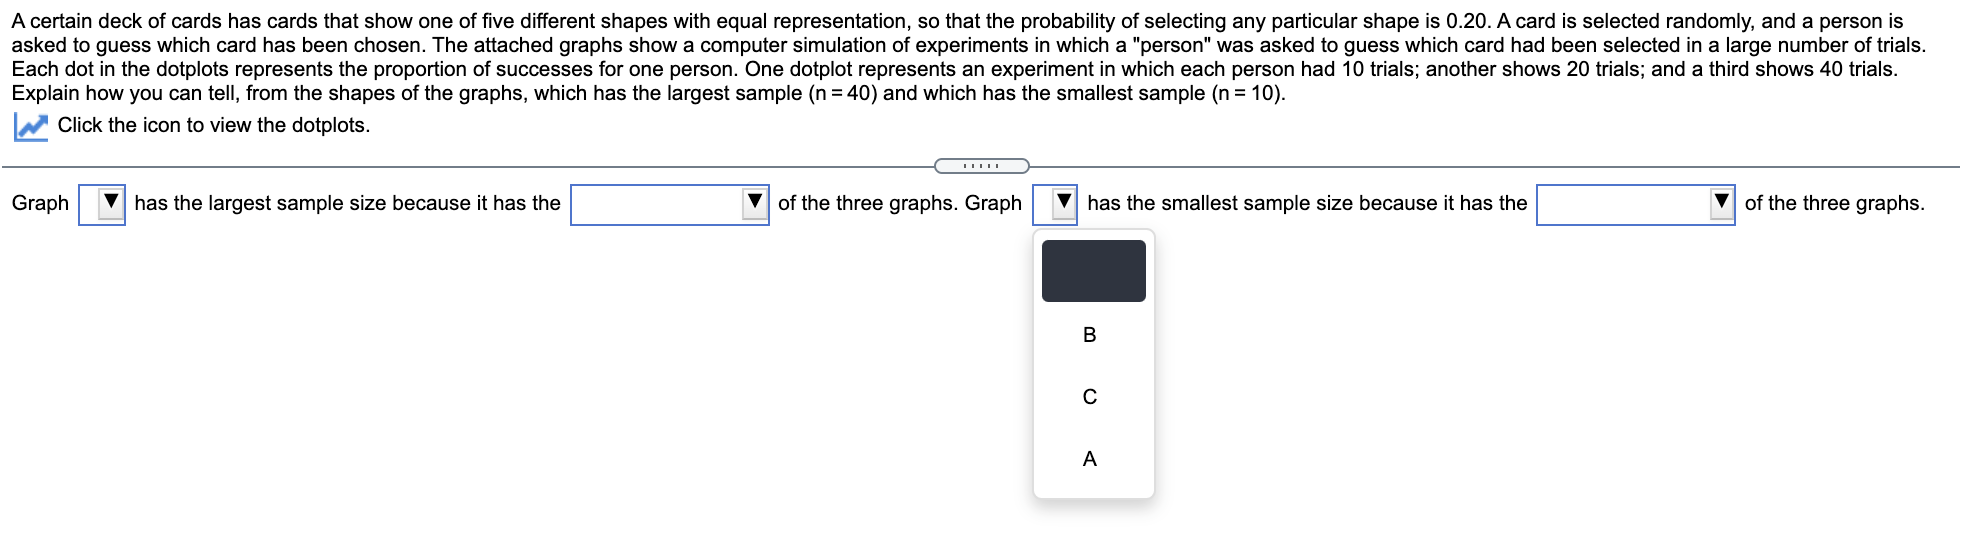
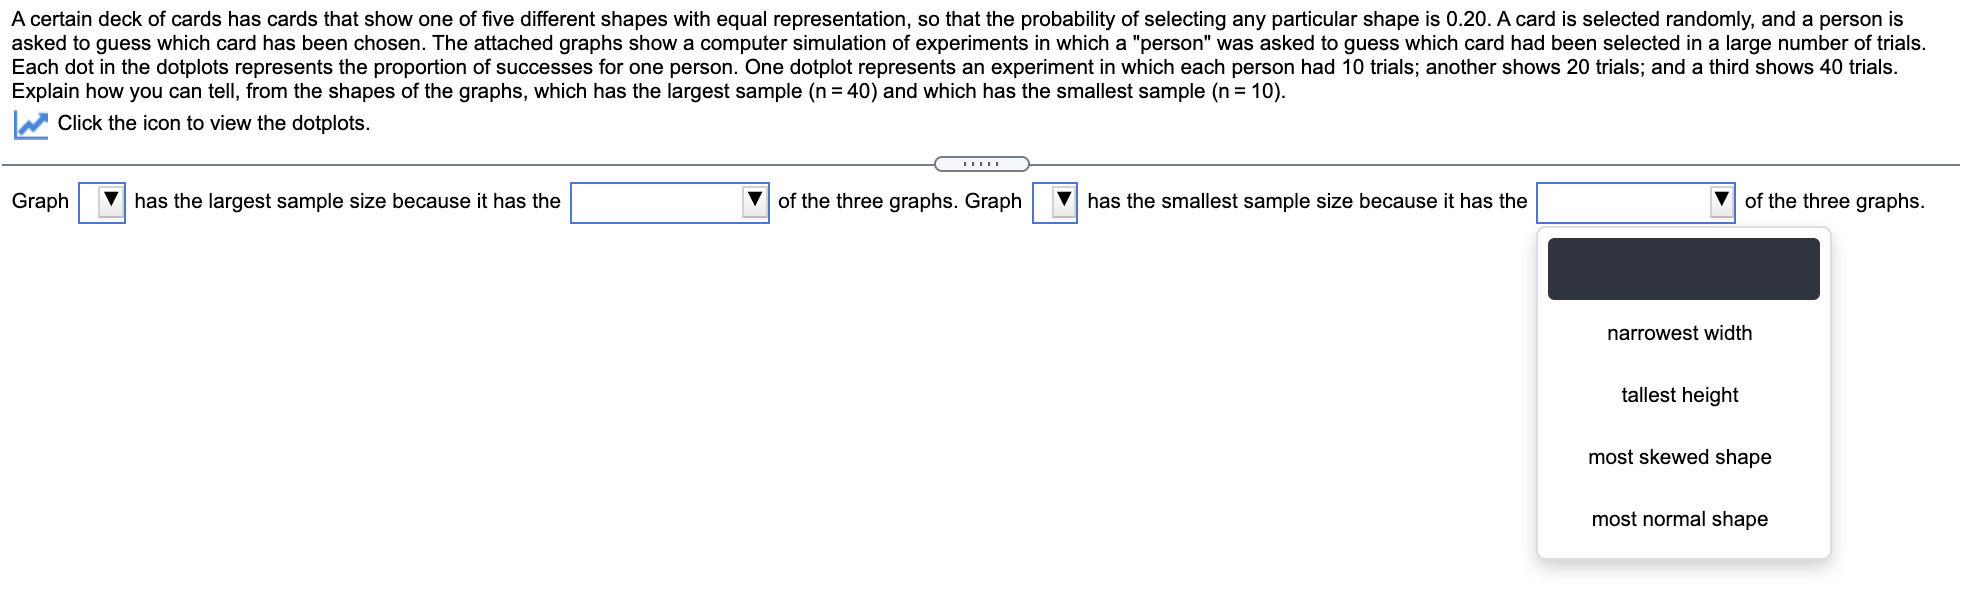
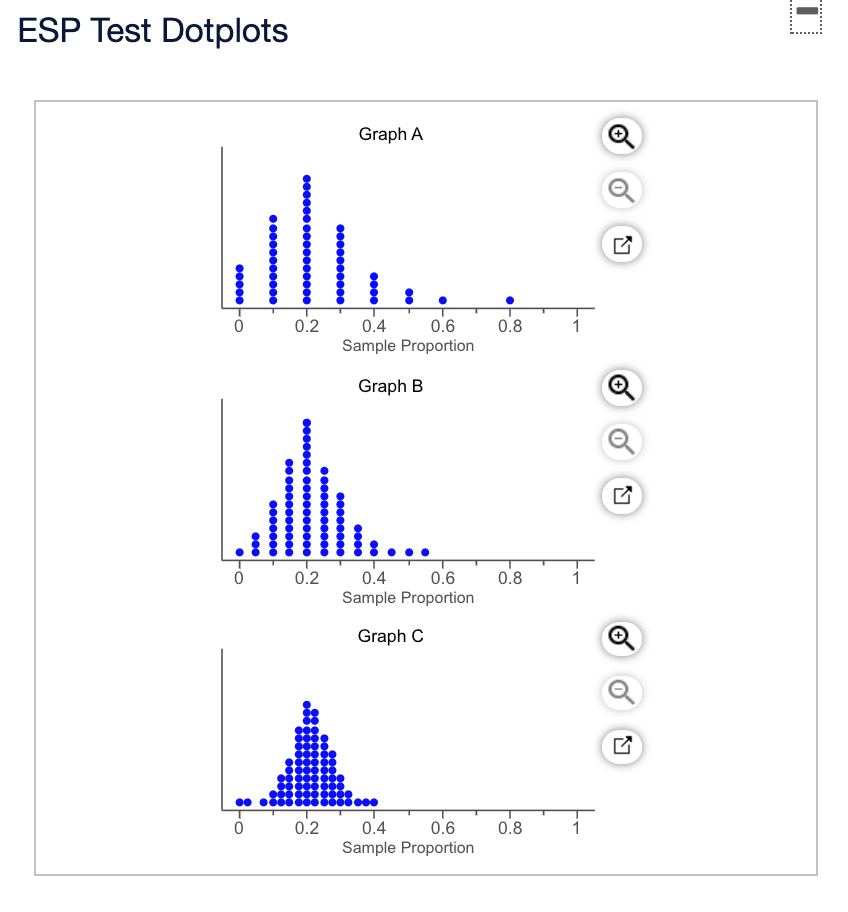
Acertain deck of cards has cards that show one of ve different shapes with equal representation, so that the probability of selecting any particular shape is 0.20. A card is selected randomly, and a person is asked to guess which card has been chosen. The attached graphs show a computer simulation of experiments in which a "person" was asked to guess which card had been selected in a large number of trials. Each dot in the dotplots represents the proportion of successes for one person. One dotplot represents an experiment in which each person had 10 trials; another shows 20 trials; and a third shows 40 trials. Explain how you can tell, from the shapes of the graphs, which has the largest sample (n = 40) and which has the smallest sample (n = 10). K Click the icon to view the dotplots. Graph El has the largest sample size because it has the |:| of the three graphs. Graph El has the smallest sample size because it has the |:| of the three graphs. C Acertain deck of cards has cards that show one of ve different shapes with equal representation, so that the probability of selecting any particular shape is 0.20. A card is selected randomly, and a person is asked to guess which card has been chosen. The attached graphs show a computer simulation of experiments in which a "person" was asked to guess which card had been selected in a large number of trials. Each dot in the dotplots represents the proportion of successes for one person. One dotplot represents an experiment in which each person had 10 trials; another shows 20 trials; and a third shows 40 trials. Explain how you can tell, from the shapes of the graphs, which has the largest sample (n = 40) and which has the smallest sample (n = 10). [i Click the icon to View the dotplots. Graph El has the largest sample size because it has the |:| of the three graphs. Graph El has the smallest sample size because it has the El of the three graphs. most normal shape tallest height widest width most skewed shape Acertain deck of cards has cards that show one ofve different shapes with equal representation, so that the probability of selecting any particular shape is 0.20. A card is selected randomly, and a person is asked to guess which card has been chosen. The attached graphs show a computer simulation of experiments in which a "person" was asked to guess which card had been selected in a large number of trials. Each dot in the dotplots represents the proportion of successes for one person. One dotplot represents an experiment in which each person had 10 trials; another shows 20 trials; and a third shows 40 trials. Explain how you can tell, from the shapes of the graphs, which has the largest sample (n = 40) and which has the smallest sample (n = 10). K Click the icon to view the dotplots. Graph El has the largest sample size because it has the |:| of the three graphs. Graph El has the smallest sample size because it has the |:| of the three graphs. B A certain deck of cards has cards that show one of five different shapes with equal representation, so that the probability of selecting any particular shape is 0.20. A card is selected randomly, and a person is asked to guess which card has been chosen. The attached graphs show a computer simulation of experiments in which a "person" was asked to guess which card had been selected in a large number of trials. Each dot in the dotplots represents the proportion of successes for one person. One dotplot represents an experiment in which each person had 10 trials; another shows 20 trials; and a third shows 40 trials. Explain how you can tell, from the shapes of the graphs, which has the largest sample (n = 40) and which has the smallest sample (n = 10). Click the icon to view the dotplots. Graph has the largest sample size because it has the of the three graphs. Graph has the smallest sample size because it has the of the three graphs. narrowest width tallest height most skewed shape most normal shapeESP Test Dotplots Graph A ...... ......... . O- 0.2 0.4 0.6 0.8 Sample Proportion Graph B ....... ....... .......... .......... . : . . . 0 0.2 0.4 0.6 0.8 Sample Proportion Graph C 0.2 0.4 0.6 0.8 Sample Proportion
Step by Step Solution
There are 3 Steps involved in it
Step: 1
Get Instant Access to Expert-Tailored Solutions
See step-by-step solutions with expert insights and AI powered tools for academic success
Step: 2
Step: 3
Ace Your Homework with AI
Get the answers you need in no time with our AI-driven, step-by-step assistance