

Question
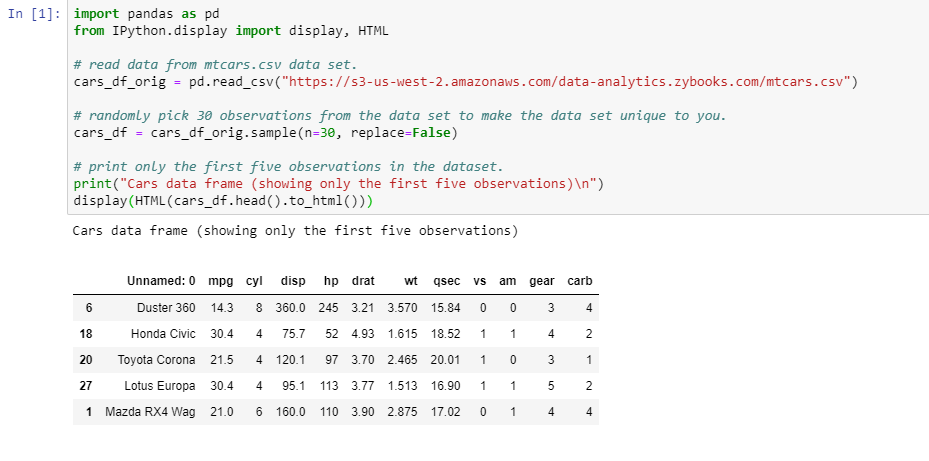
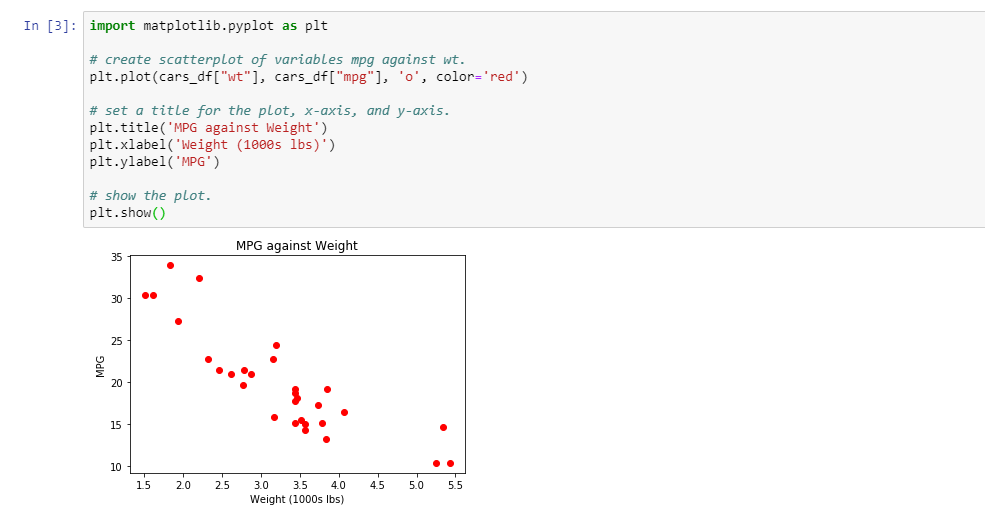
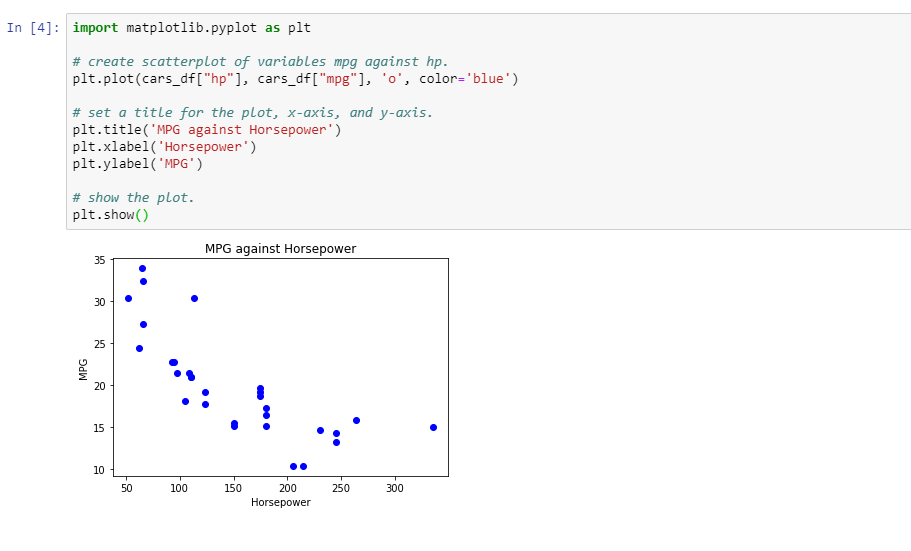
a.Check to be sure your scatterplots of miles per gallon against horsepower and weight of the car were included in your attachment. Do the plots
a.Check to be sure your scatterplots of miles per gallon against horsepower and weight of the car were included in your attachment. Do the plots show any trend? If yes, is the trend what you expected? Why or why not?
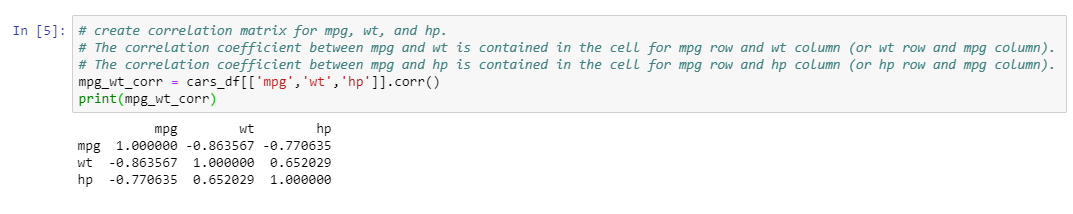
b. What are the coefficients of correlation between miles per gallon and horsepower? Between miles per gallon and the weight of the car? What are the directions and strengths of these coefficients? Do the coefficients of correlation indicate a strong correlation, weak correlation, or no correlation between these variables?
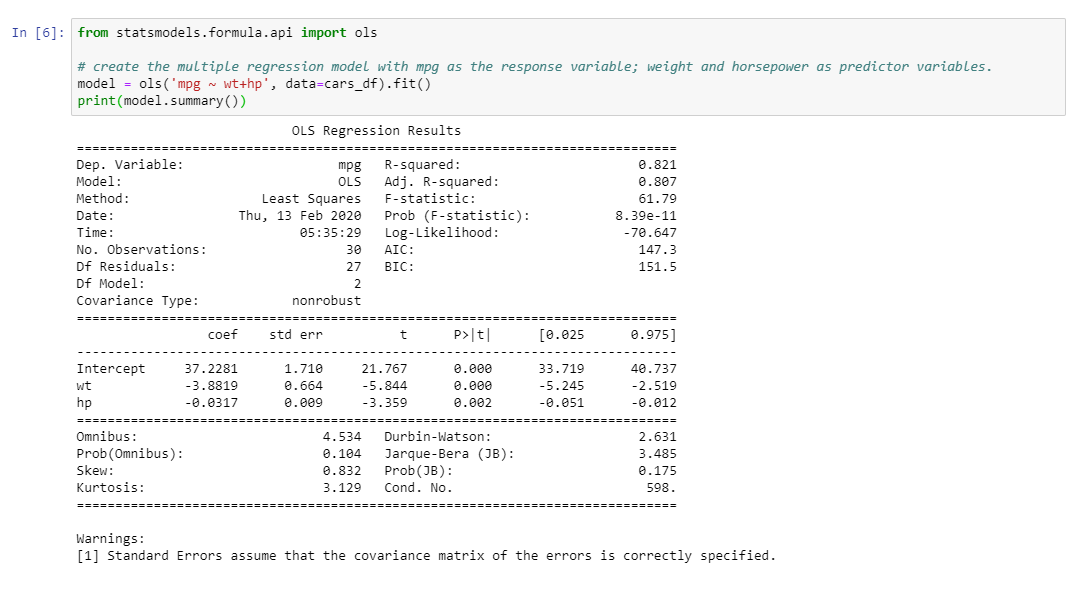
c. Write the multiple regression equation for miles per gallon as the response variable. Use weight and horsepower as predictor variables. See Step 5 in the Python script. How might the car rental company use this model?
d. Is at least one of the two variables (weight and horsepower) significant in the model? Run the overall F-test and provide your interpretation at 5% level of significance.
Step by Step Solution
There are 3 Steps involved in it
Step: 1

Get Instant Access to Expert-Tailored Solutions
See step-by-step solutions with expert insights and AI powered tools for academic success
Step: 2

Step: 3
Ace Your Homework with AI
Get the answers you need in no time with our AI-driven, step-by-step assistance
Get Started
Introduction to Probability
Authors: Mark Daniel Ward, Ellen Gundlach
1st edition
716771098, 978-1319060893, 1319060897, 978-0716771098