Question
Acme Group Inc. is a multinational strategy consultancy with global headquarters in Melbourne, Australia. The company has an annual revenue of $500M, to maintain their
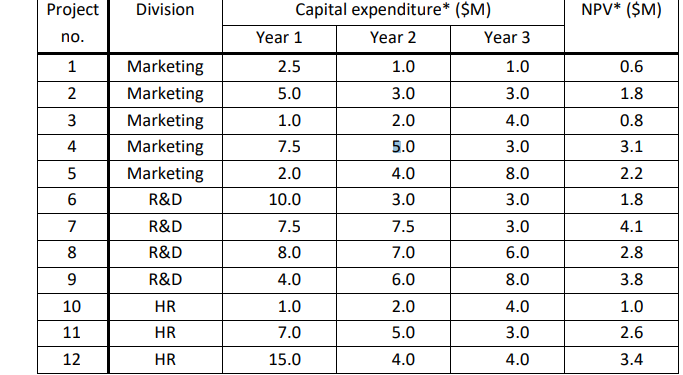
Acme Group Inc. is a multinational strategy consultancy with global headquarters in Melbourne, Australia. The company has an annual revenue of $500M, to maintain their competitive position Acme Group needs to continually look for opportunities to invest in new technologies. The Chief Information Officer, Jane Porter, is currently considering twelve technology proposals put forth by three divisions within the Group Marketing, R&D, and HR. Each division has provided Jane with the capital expenditures required for each project over the next three years and, based on the expected revenue to be generated by each project, the NPV of each project as shown below.

After consulting with the Chief Financial Officer, John Clayton, the CEO, Edgar Burroughs, has given Jane an overall three-year budget of $100 million for the set of projects she approves, with a maximum of $40 million available in any one year. Jane has now tasked you with developing spreadsheetbased decision models that can be used to explore the twelve investment alternatives. The information that Jane is particularly interested in is the following:
- Number of projects undertaken in each division 2. Capital expenditures ($M) - company wide and by division. 3. NPV and ROI by project, as well as the overall NPV and ROI across all selected investments.
While calculating the model 3 Optimization as below should be used :
Optimisation Approach 1-For this approach, Jane wants to regard each project as being scalable. In other words, a percentage of each project can be invested in, anywhere from 0% to 100%. For example, if she were to invest in 75% of a project then the annual CXs and NPV for the project would be correspondingly reduced to 75% of the quoted amounts. She wants you to find the values of these project percentages that maximise the following expression: (1 r) (Overall NPV) r (Overall CX) such that for each division the sum of the percentages of the selected projects is at least 100%. The parameter r is a measure of risk aversion. For example, someone who chooses r = 0 is unconcerned with cost, and is instead completely focused on maximising the overall NPV. At the other extreme, someone who chooses r = 1 is focused on minimising the overall cost. Values of r between 0 and 1 indicate varying degrees of risk aversion.
Optimization Approach -2-In this approach, Jane wants you to assume that each project is either fully funded or is not invested in (i.e. projects are no longer scalable). She wants to a set of exactly 8 projects, with at least one project selected from each division. She wants no more than 3 of the projects to be chosen from Marketing. Finally, she wants the selection of project 12 to be contingent on both projects 10 and 11 being selected. The goal is to achieve the maximum overall NPV, subject to the necessary requirements. Your tasks here are: Construct a spreadsheet model. Use Solver to determine the optimal set of projects .
Approach 3 -In this approach, Jane wants to again regard each project as being scalable, with at least one project to be selected from each division. This time her goal is to achieve the maximum overall ROI, subject to the necessary requirements. Your tasks here are: Construct a spreadsheet model. Use Solver to determine the optimal set of projects.
Project Division NPV* ($M) Capital expenditure* ($M) Year 1 Year 2 Year 3 no. 1 2.5 1.0 0.6 2 3.0 1.8 Marketing Marketing Marketing Marketing Marketing R&D 3 4 1.0 3.0 2.0 5.0 5.0 1.0 7.5 4.0 3.0 8.0 3.0 0.8 3.1 2.2 5 2.0 4.0 3.0 10.0 1.8 6 7 8 7.5 4.1 R&D R&D R&D 7.5 7.0 3.0 6.0 8.0 2.8 9 4.0 6.0 8.0 3.8 1.0 2.0 4.0 1.0 10 11 HR HR 7.0 5.0 3.0 2.6 12 HR 15.0 4.0 4.0 3.4 Project Division NPV* ($M) Capital expenditure* ($M) Year 1 Year 2 Year 3 no. 1 2.5 1.0 0.6 2 3.0 1.8 Marketing Marketing Marketing Marketing Marketing R&D 3 4 1.0 3.0 2.0 5.0 5.0 1.0 7.5 4.0 3.0 8.0 3.0 0.8 3.1 2.2 5 2.0 4.0 3.0 10.0 1.8 6 7 8 7.5 4.1 R&D R&D R&D 7.5 7.0 3.0 6.0 8.0 2.8 9 4.0 6.0 8.0 3.8 1.0 2.0 4.0 1.0 10 11 HR HR 7.0 5.0 3.0 2.6 12 HR 15.0 4.0 4.0 3.4
Step by Step Solution
There are 3 Steps involved in it
Step: 1

Get Instant Access to Expert-Tailored Solutions
See step-by-step solutions with expert insights and AI powered tools for academic success
Step: 2

Step: 3

Ace Your Homework with AI
Get the answers you need in no time with our AI-driven, step-by-step assistance
Get Started


