Answered step by step
Verified Expert Solution
Question
1 Approved Answer
A)Complete an analysis and report for Falcon inc B)How would you assess the financial performance of the divison managers in Mexico, Denmark, and Japan? Which
A)Complete an analysis and report for Falcon inc
B)How would you assess the financial performance of the divison managers in Mexico, Denmark, and Japan? Which managers should be awarded the highest bonus, and which should be given the lowest?
C)If ROI, rather than profit margin, were used as the performance measure, would the performance ranking of the three subsidaries be different? What are the advantages and limitations of using ROI as the indicator? Wpuld ROI be a superior metric over the current metric?


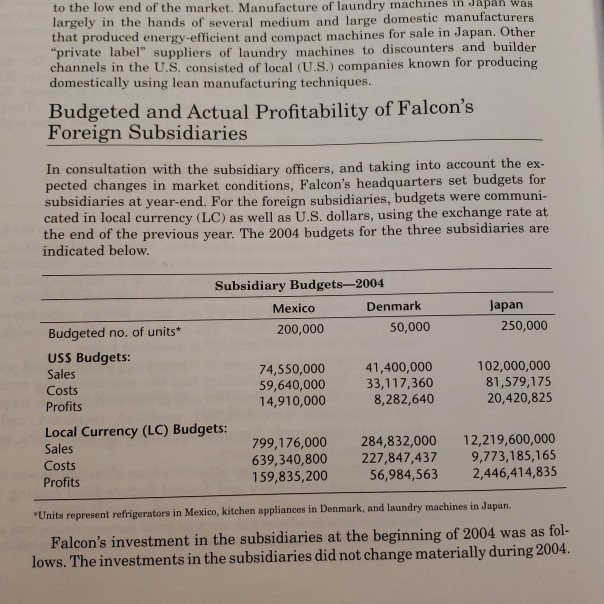
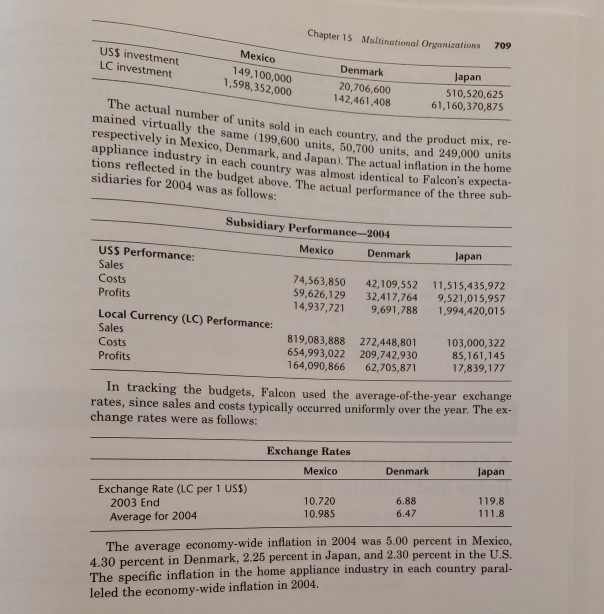
to the low end of the market. Manufacture of machines was largely in the hands of several medium and large domestic manufacturers produced energy-efficient and compact machines for sale in Japan. Other laundry in Japan that es to discounters and builder private label" channels in the U.S, consisted of local (U.S.) companies known for producing domestically using lean manufacturing techniques. suppliers of laundry machin Budgeted and Actual Profitability of Falcon's Foreign Subsidiaries In consultation with the subsidiary officers, and taking into account the ex pected changes in market conditions, Falcon's headquarters set subsidiaries at year-end. For the foreign subsidiaries, budgets were communi- cated in local currency (LC) as well as U.S. dollars, using the exchange rate at the end of the previous year. The 2004 budgets for the three subsidiaries are indicated below budgets for Subsidiary Budgets-2004 Mexico Denmark apan 200,000 50,000 250,000 Budgeted no. of units* USS Budgets: Sales Costs Profits 74,550,000 59,640,000 14,910,000 41,400,000 33,117,360 8,282,640 102,000,000 81,579,175 20,420,825 Local Currency (LC) Budgets: Sales Costs Profits 799,176,000 284,832,000 12,219,600,000 639,340,800 227,847,437 9,773,185,165 56,984,563 159,835,200 2,446,414,835 Units represent refrigerators in Mexico, kitchen appliances in Denmark, and laundry machines in J Falcon's investment in the subsidiaries at the beginning of 2004 was as fol- lows. The investments in the subsidiaries did not change materially during 2004 Chapter 15 Multinational Organizations 709 USS investment LC investment Mexico 149,100,000 1,598,352,000 Denmark 20,706,600 142,461,408 Japan 510,520,625 61,160,370,875 The actual number of units sold in mained virtually the same (199,600 units, 50,700 units, and 249,0% each country, and the product mix, re- respectively in Mexico, Denmark, and Japan). The actual inflation in the home appliance industry in each country was almost identical to Falcon's expecta tions reflected in the budget above. The actual performance of the three su sidiaries for 2004 was as follows: b- Subsidiary Performance-2004 Mexico Denmark Japan USS Performance: Sales Costs Profits 74,563,850 42,109,552 11,515,435,972 59,626,129 32,417,764 9,521,015,957 14,937,721 9,691,788 1,994,420,015 Local Currency (LC) Performance: Sales Costs Profits 819,083,888 272,448,801 103,000,322 654,993,022 209,742,930 164,090,866 62,705,871 85,161,145 17,839,177 In tracking the budgets, Falcon used the average-of-the-year exchange rates, since sales and costs typically occurred uniformly over the year. The ex- change rates were as follows: Exchange Rates Japan Mexico Denmark 119.8 6.88 6.47 Exchange Rate (LC per 1 USS) 2003 End Average for 2004 10.720 10.985 2004 was 5.00 percent in Mexico, 4.30 percent in Denmark, 2.25 percent in Japan, and 2.30 percent in the U.S The specific inflation in the home appliance industry in each country paral leled the economy-wide inflation in 2004. The average economy-wide inflation in to the low end of the market. Manufacture of machines was largely in the hands of several medium and large domestic manufacturers produced energy-efficient and compact machines for sale in Japan. Other laundry in Japan that es to discounters and builder private label" channels in the U.S, consisted of local (U.S.) companies known for producing domestically using lean manufacturing techniques. suppliers of laundry machin Budgeted and Actual Profitability of Falcon's Foreign Subsidiaries In consultation with the subsidiary officers, and taking into account the ex pected changes in market conditions, Falcon's headquarters set subsidiaries at year-end. For the foreign subsidiaries, budgets were communi- cated in local currency (LC) as well as U.S. dollars, using the exchange rate at the end of the previous year. The 2004 budgets for the three subsidiaries are indicated below budgets for Subsidiary Budgets-2004 Mexico Denmark apan 200,000 50,000 250,000 Budgeted no. of units* USS Budgets: Sales Costs Profits 74,550,000 59,640,000 14,910,000 41,400,000 33,117,360 8,282,640 102,000,000 81,579,175 20,420,825 Local Currency (LC) Budgets: Sales Costs Profits 799,176,000 284,832,000 12,219,600,000 639,340,800 227,847,437 9,773,185,165 56,984,563 159,835,200 2,446,414,835 Units represent refrigerators in Mexico, kitchen appliances in Denmark, and laundry machines in J Falcon's investment in the subsidiaries at the beginning of 2004 was as fol- lows. The investments in the subsidiaries did not change materially during 2004 Chapter 15 Multinational Organizations 709 USS investment LC investment Mexico 149,100,000 1,598,352,000 Denmark 20,706,600 142,461,408 Japan 510,520,625 61,160,370,875 The actual number of units sold in mained virtually the same (199,600 units, 50,700 units, and 249,0% each country, and the product mix, re- respectively in Mexico, Denmark, and Japan). The actual inflation in the home appliance industry in each country was almost identical to Falcon's expecta tions reflected in the budget above. The actual performance of the three su sidiaries for 2004 was as follows: b- Subsidiary Performance-2004 Mexico Denmark Japan USS Performance: Sales Costs Profits 74,563,850 42,109,552 11,515,435,972 59,626,129 32,417,764 9,521,015,957 14,937,721 9,691,788 1,994,420,015 Local Currency (LC) Performance: Sales Costs Profits 819,083,888 272,448,801 103,000,322 654,993,022 209,742,930 164,090,866 62,705,871 85,161,145 17,839,177 In tracking the budgets, Falcon used the average-of-the-year exchange rates, since sales and costs typically occurred uniformly over the year. The ex- change rates were as follows: Exchange Rates Japan Mexico Denmark 119.8 6.88 6.47 Exchange Rate (LC per 1 USS) 2003 End Average for 2004 10.720 10.985 2004 was 5.00 percent in Mexico, 4.30 percent in Denmark, 2.25 percent in Japan, and 2.30 percent in the U.S The specific inflation in the home appliance industry in each country paral leled the economy-wide inflation in 2004. The average economy-wide inflation in
Step by Step Solution
There are 3 Steps involved in it
Step: 1

Get Instant Access to Expert-Tailored Solutions
See step-by-step solutions with expert insights and AI powered tools for academic success
Step: 2

Step: 3

Ace Your Homework with AI
Get the answers you need in no time with our AI-driven, step-by-step assistance
Get Started


