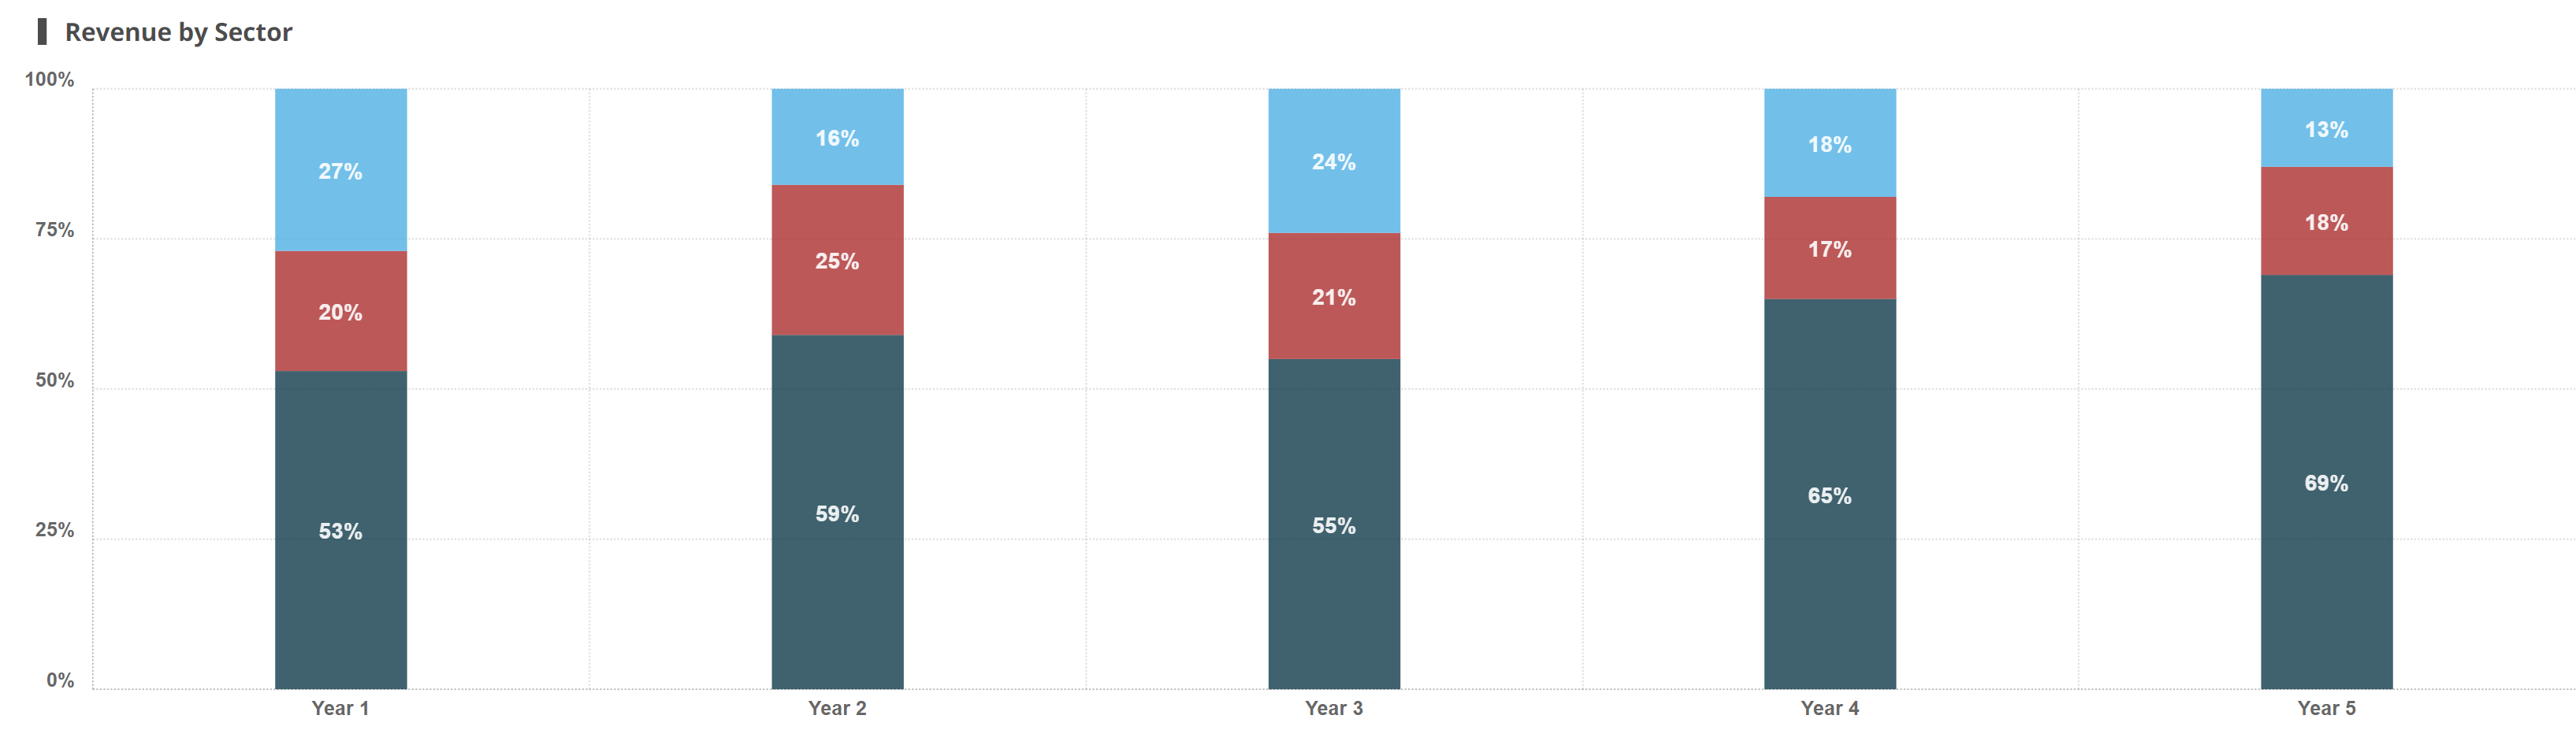
Across the five years, what is the average revenue generated by sales to public institutions?
A) $498,260,000
B) $99,652,000
C) $500,800,000
D) $307,580,000
E) $93,568,000
What is the difference in revenue generated between sales to businesses and sales to private individuals in Year 5?
A) $358,400,000
B) $207,872,000
C) $150,528,000
D $326,400,000
E) $166,400,000
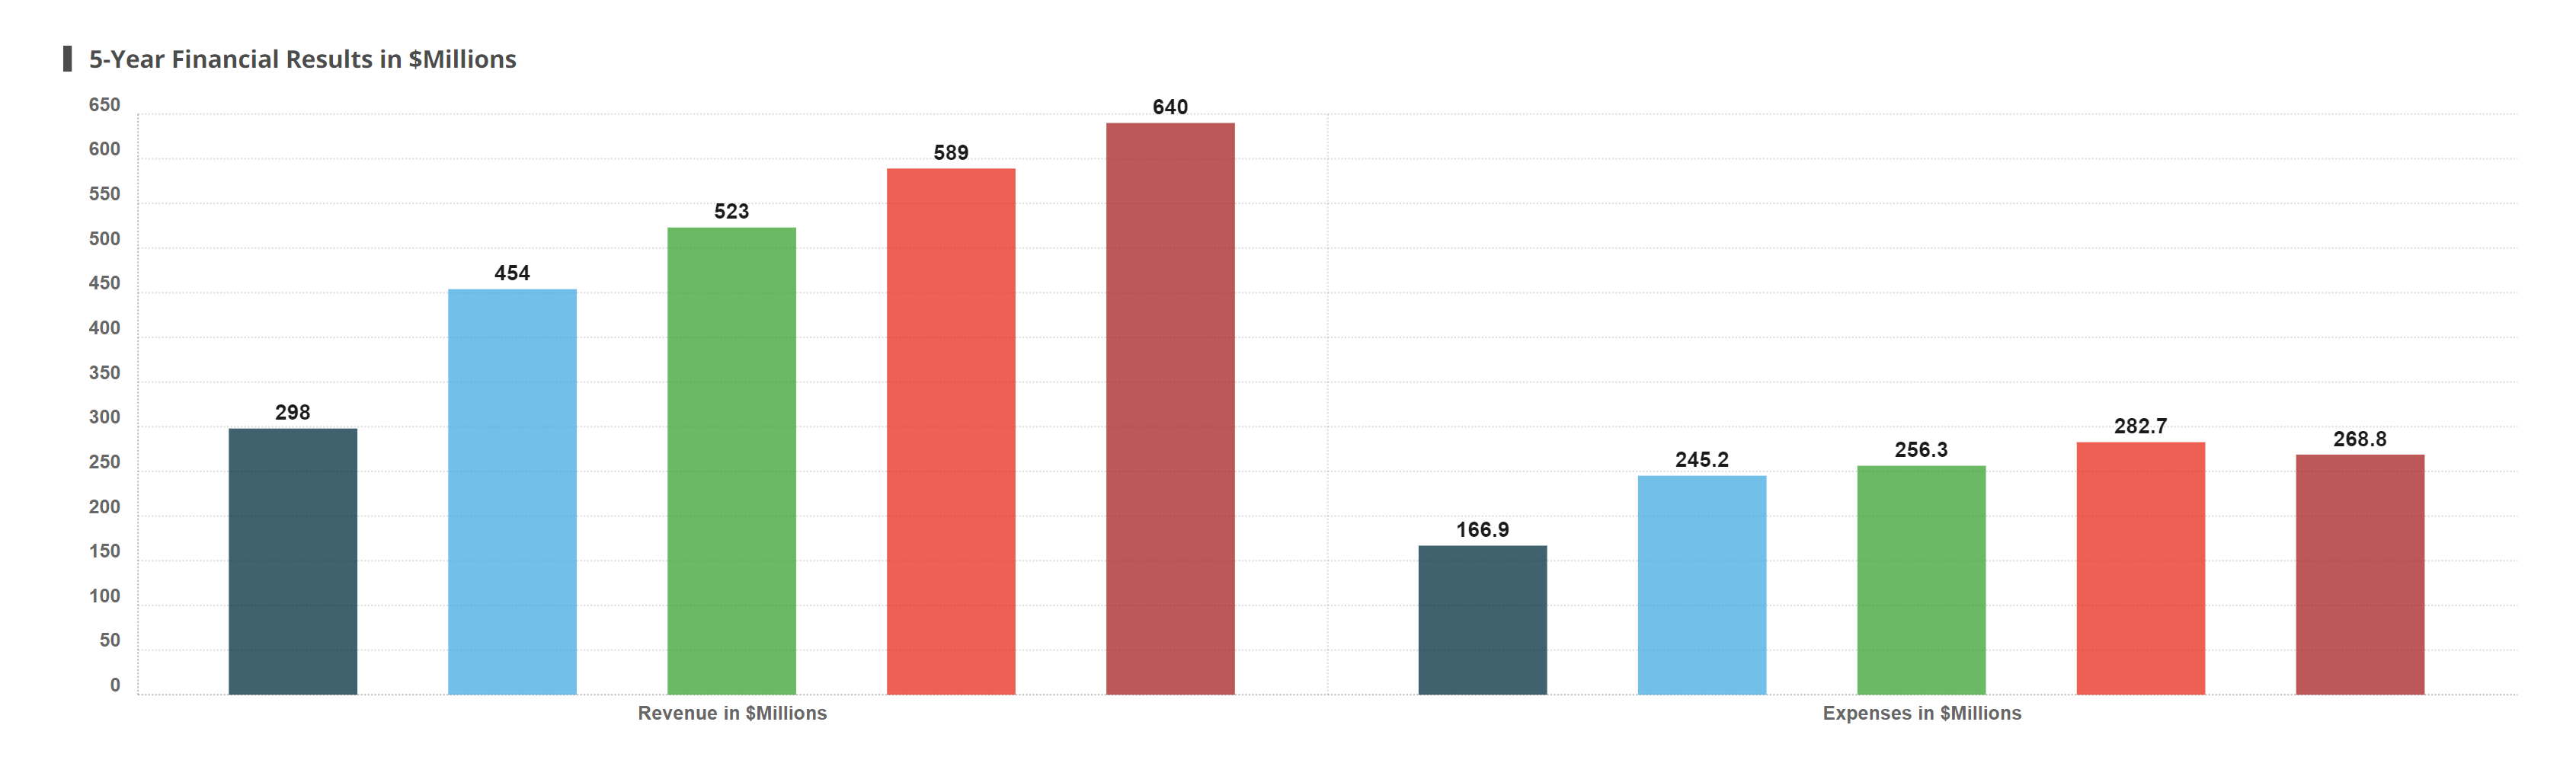
The lead consultant on the project with Talabot & Hopkins is interested in Talabot & Hopkin's profit development over Year 1 to Year 5.
A) Talabot & Hopkins' proportional profit decreased over the five years.
B) Talabot & Hopkins' profit increased year on year over the five years.
C) Talabot & Hopkins' profit increased over the five years, mainly driven by their sales to private individuals,
D) Talabot & Hopkins'expenses decreased over the five years, which significantly contributed to the profit increase.
E) Talabot & Hopkin's profit increased from $131.1 M in Year 1 to $317.2m in Year 5.
OUR STORY Founded in 1963 in Chicago by pioneering architect Robert Talabot, Talabot & Hopkins Inc has grown to become a global architectural firm with over 700 employees and 12 offices across North America, Europe and Asia. Since the beginning, it has been our ambition to design buildings and spaces that elegantly interlace functional, aesthetic and technical aspects to meet the requirements of our clients whilst also inspiring everyone who comes into contact with them. Over the decades, we have built an international reputation of exploring the limits of every project, using our technical and creative expertise to develop tailored solutions for our clients. Our success is documented by an award-winning portfolio covering large-scale projects across the globe and diverse, long-standing client relationships. WHAT WE DO Talabot & Hopkins Inc provides architectural designs and interior design consultancy for a wide range of clients. We work on residential projects, apartment buildings and residential houses. We also work on commercial buildings for private and public use. Some of our most famous buildings include the Majout Casino Complex in Cambodia, our first Asian contract, as well as the Frahm Opera House in the USA and the Medkas office complex in Paris. We are renowned for our enthusiasm for involving our clients in the work we do. No two buildings we create are ever the same and we would like to ensure that everything we create is bespoke to the needs of our clients. WHO WE ARE Talabot & Hopkins Inc currently has 760 employees. The majority of employees are based in North America (42%) and Europe (31%). Since we opened our offices we have had continual growth in the number of employees who work with us, due to a conservative and steady expansion strategy and a continually growing customer base. WHERE WE WORK Our first move out of Chicago was into Massachusetts, where we acquired a small company and began working on the design of an office park outside of Boston. This project resulted in our first award for architectural excellence. Five years later, we won our first contract in Europe, which was in partnership with ForslunDesign. After the successful delivery of this project, we acquired this small firm. This grew our number of employees to 220. We continued to deliver projects that turn our clients' vision into a reality across the continent. More recently we have opened offices in Asia, prior to designing and completing our first residential buildings there. | 5-Year Financial Results in $Millions 650 640 600 589 550 523 500 454 450 400 350 300 298 282.7 268.8 256.3 250 245.2 200 166.9 150 100 50 0 Revenue in $Millions Expenses in $Millions | Staff Growth Relative to Current Number of Employees in Each Region United States 13% Europe 8% Asia 22% 0% 1% 2% 3% 4% 5% 6% 7% 8% 9% 10% 11% 12% 13% 14% 15% 16% 17% 18% 19% 20% 21% 22% Growth Revenue by Sector 100% 16% 13% 18% 27% 24% 75% 18% 17% 25% 21% 20% 50% 69% 65% 59% 25% 53% 55% 0% Year 1 Year 2 Year 3 Year 4 Year 5