Activity 1 was done on here. I can send you the question and answer if u like to reference it
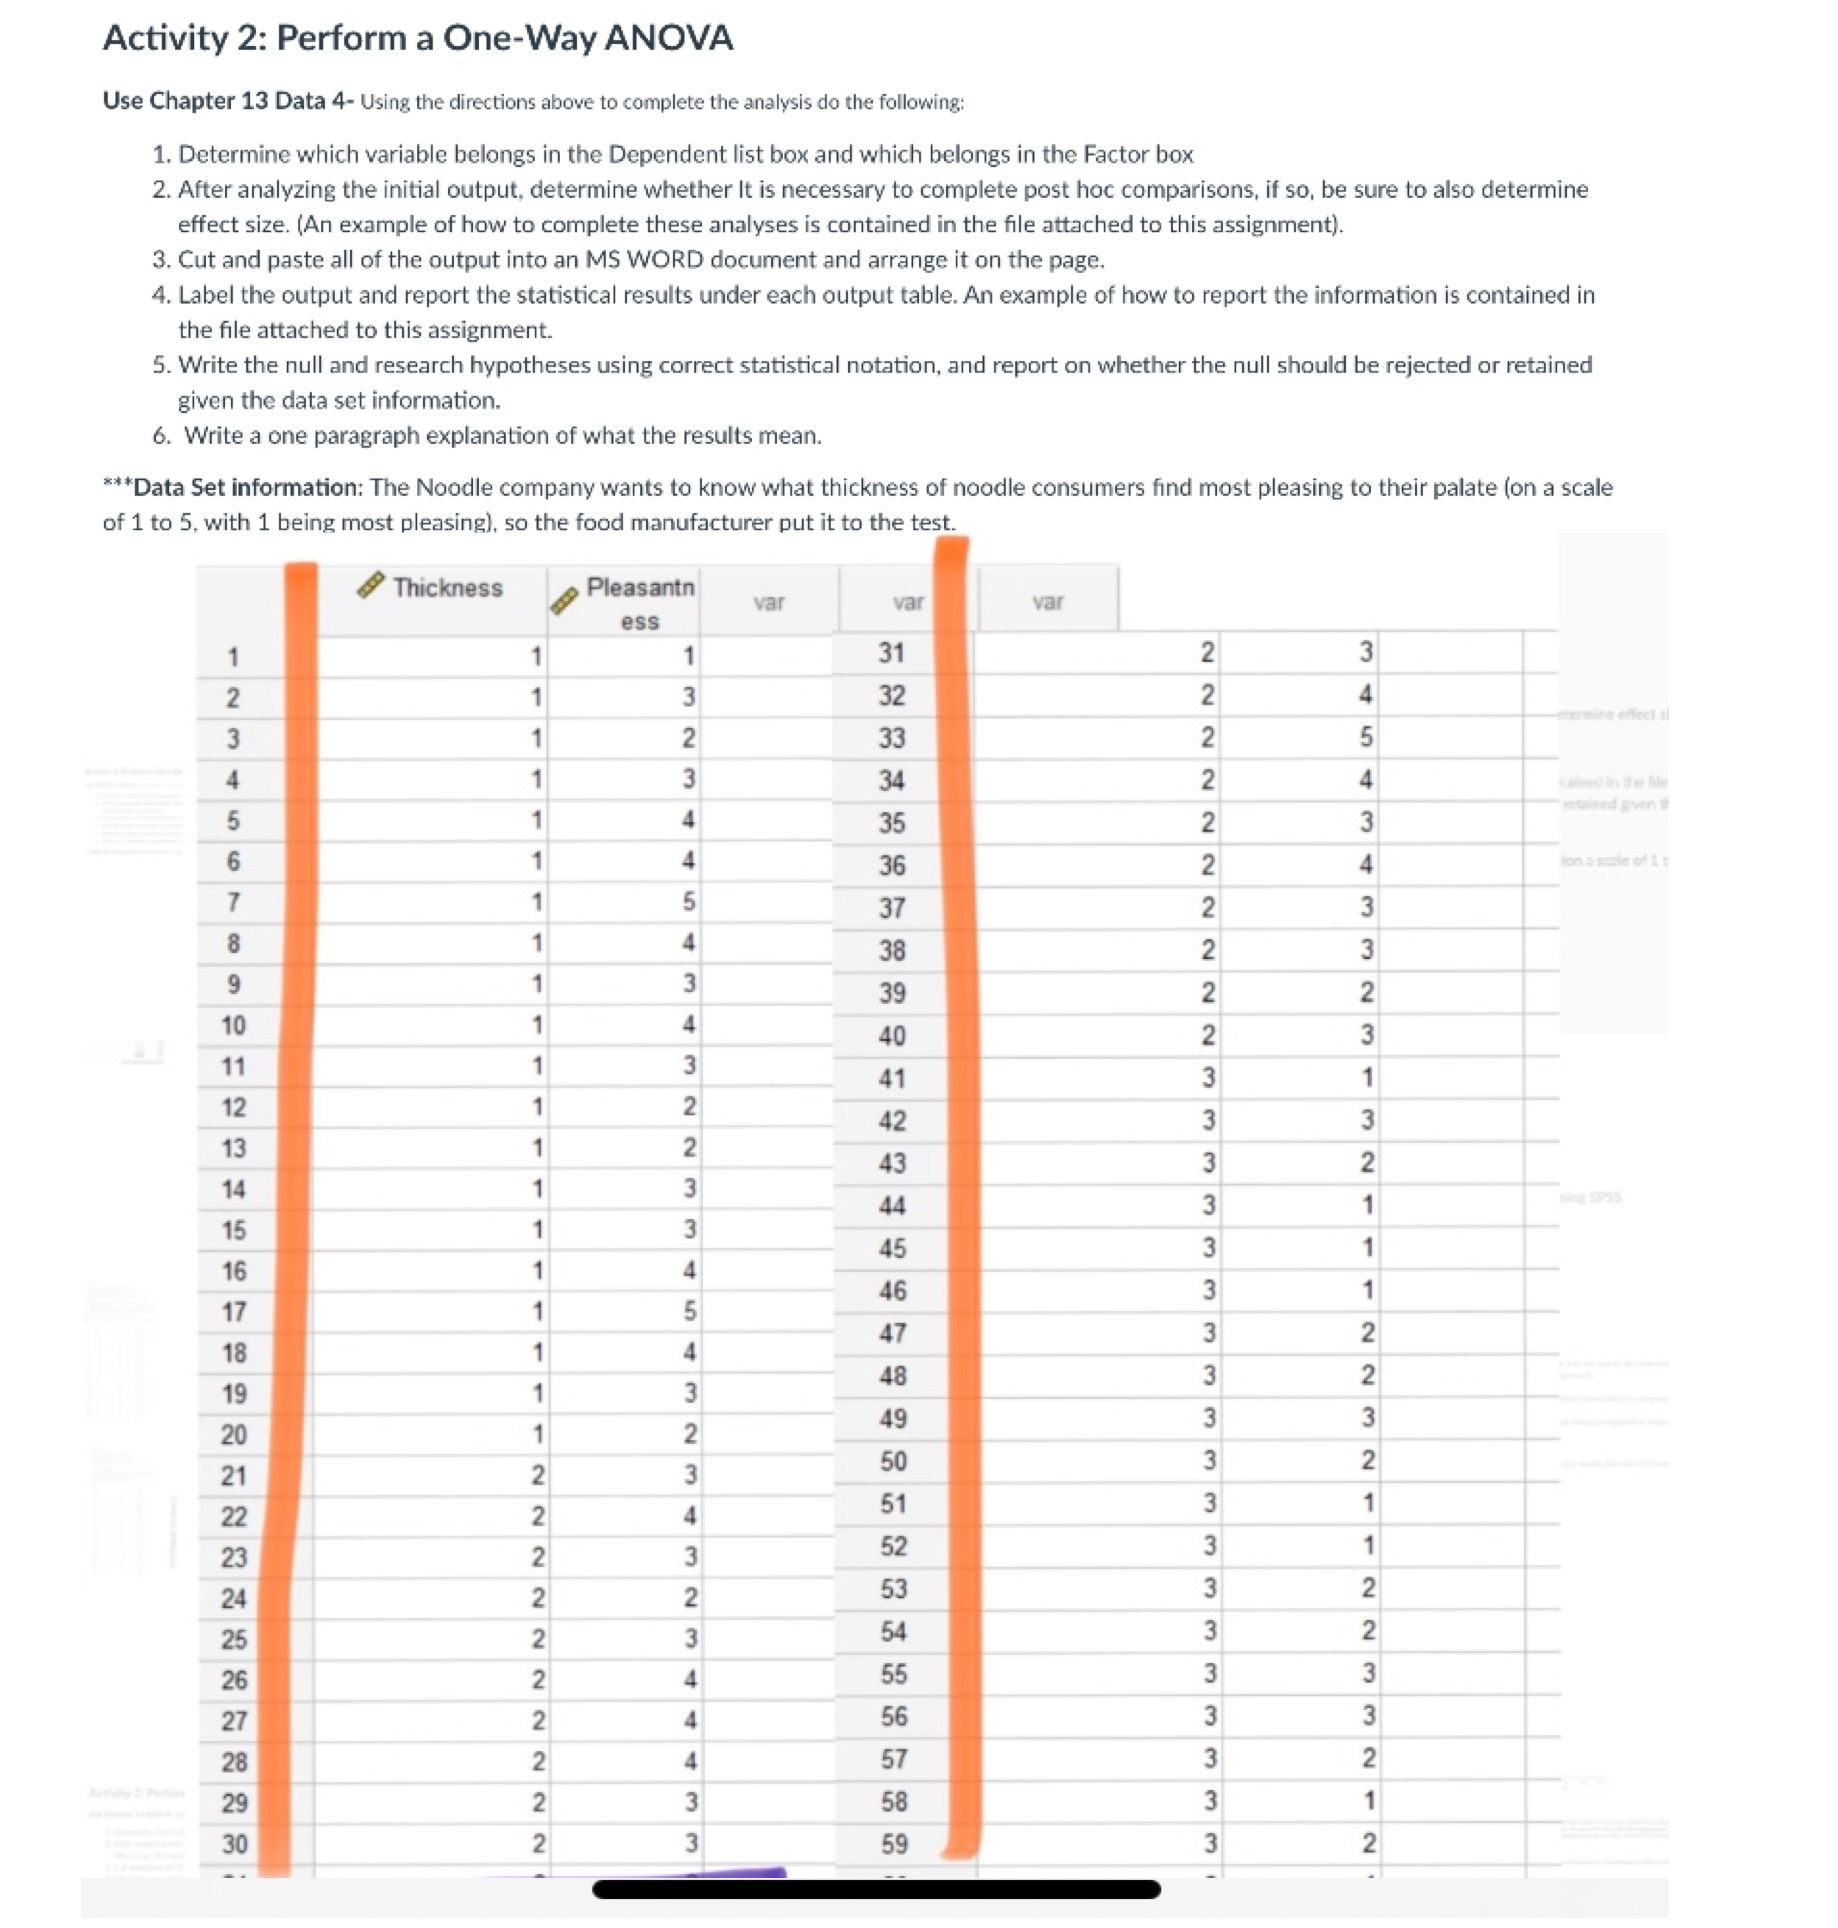
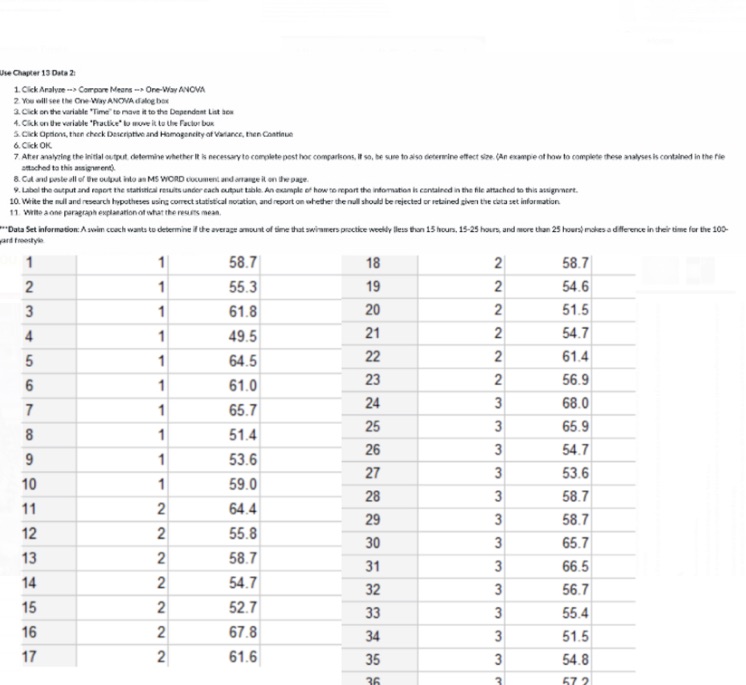
Activity 2: Perform a One-Way ANOVA Use Chapter 13 Data 4- Using the directions above to complete the analysis do the following: 1. Determine which variable belongs in the Dependent list box and which belongs in the Factor box 2. After analyzing the initial output, determine whether It is necessary to complete post hoc comparisons, if so, be sure to also determine effect size. (An example of how to complete these analyses is contained in the file attached to this assignment). 3. Cut and paste all of the output into an MS WORD document and arrange it on the page. 4. Label the output and report the statistical results under each output table. An example of how to report the information is contained in the file attached to this assignment. 5. Write the null and research hypotheses using correct statistical notation, and report on whether the null should be rejected or retained given the data set information. 6. Write a one paragraph explanation of what the results mean. **Data Set information: The Noodle company wants to know what thickness of noodle consumers find most pleasing to their palate (on a scale of 1 to 5, with 1 being most pleasing), so the food manufacturer put it to the test. Thickness Pleasantn var var var ess 31 3 32 33 W N 34 mined given 35 36 lon a scale of 1 t . N - N W W N N - - N W N N J J - N W - W N W W A W A U A W I W W W W W W W W W W W W W W W W W W W N N N N N N NN NN W W A A A W N W A W N W A UA W W N N W AWAY INNNNNNNNNN-The Chapter 13 Data 2: 1. Click Aralyee ... Compare Meors - Ore-Way ANOVA 2. You alll see the One Way ANOVA dialog box 3. Click on the variable "Time" to mave it to the Dependent List bea 4. Click on the variable "Practice" to move it is tre Factor bus 5. Cirk Option, then chock Description and Hiimagincity of Valance, Phan Continue &. Click OK. 7. After analyzing the initial output defor her It is necessary to complete post hoc comparisons, If so, be are to also determine effect size. (An example of how to complete these analyses is contained in the file Butsched to this assignment 8. CA and paste all of The what his as MS WORD document and anange it on le page 9. Libel the output and report or each output table. An example of how to report the information is contained in the file attached to this atugemmert. 10. White the null and research hypotheses using correct statistical nocation, and report on whether he null should be rejected or retained given the data set information 11. Wille a nine paragraph explanation of what the reuurts mean. "Data Set Information: A swim coach wants to determine If he average amount of time that swimmers practice weekly Bless than 15 hours, 19-25 hours, and more than 23 hours) makes a difference in their time for the 100- and fromityin 58.7 18 IN 58.7 55.3 19 2 54.6 61.8 20 2 51.5 49.5 21 2 54.7 64.5 22 2 61.4 61.0 23 2 56.9 65.7 24 3 68.0 25 3 65.9 51.4 26 3 54.7 53.6 27 3 53.6 59.0 28 58.7 64.4 W W 29 58.7 N 55.8 30 3 65.7 N 58.7 31 3 66.5 N 54.7 32 3 56.7 52.7 55.4 I N 33 W W 67.8 34 51.5 17 N 61.6 35 W 54.8


