Activity 5 General Instructions: Please place your name above, then complete the following questions. NOTE: Read the entire document below to get a feel for
Activity 5
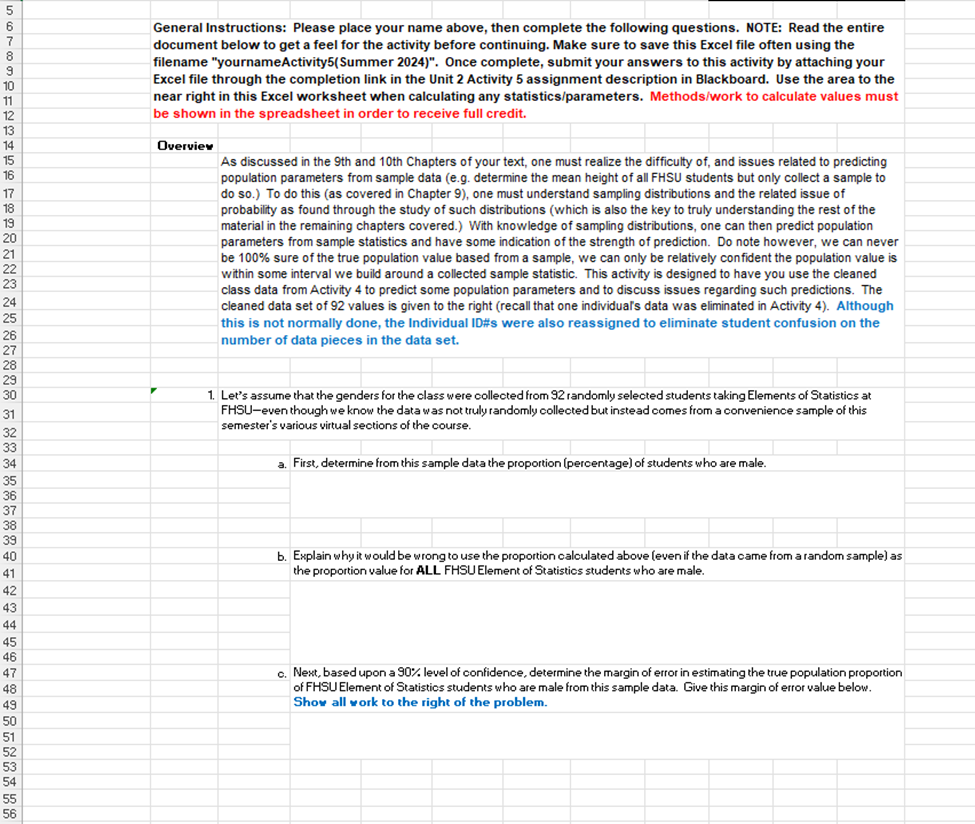
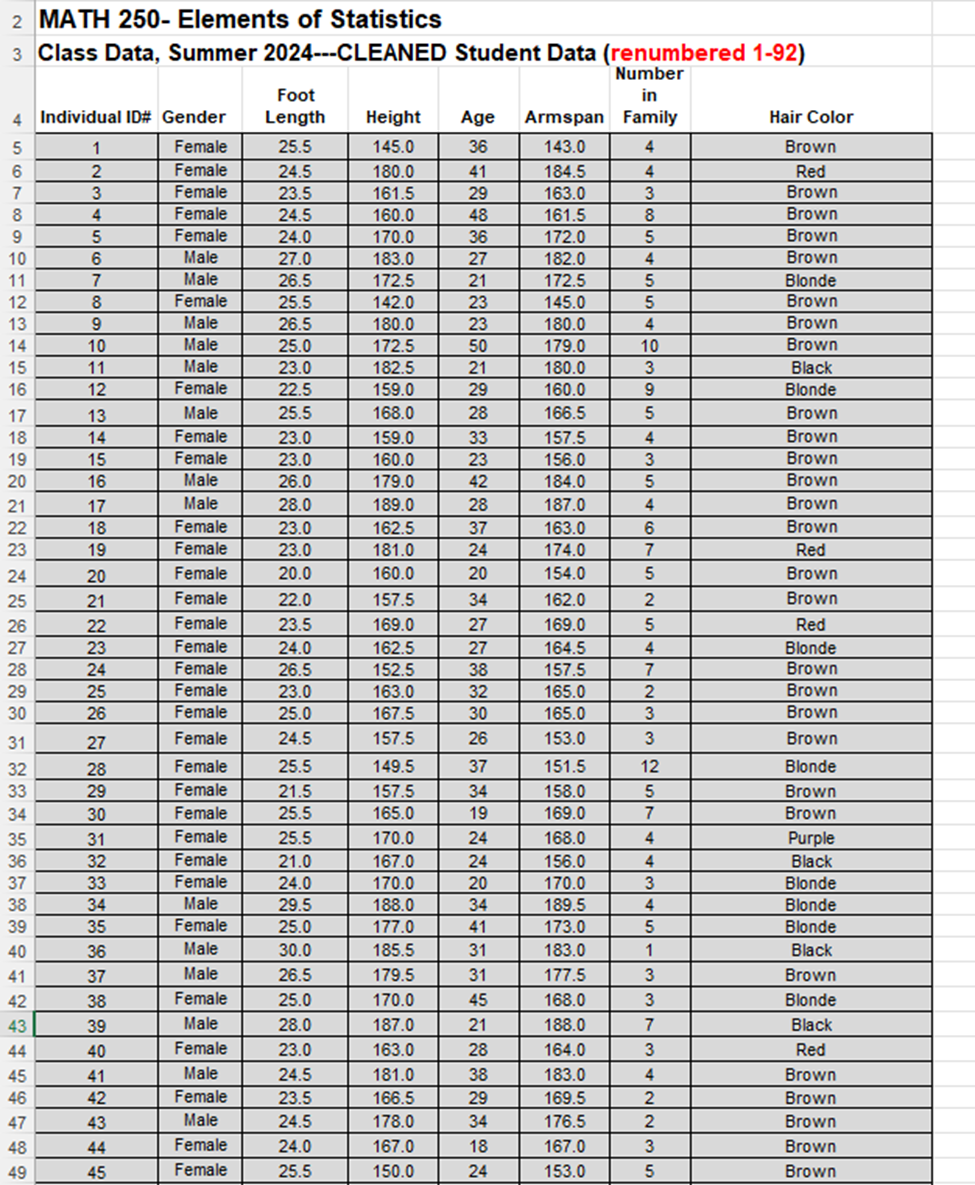
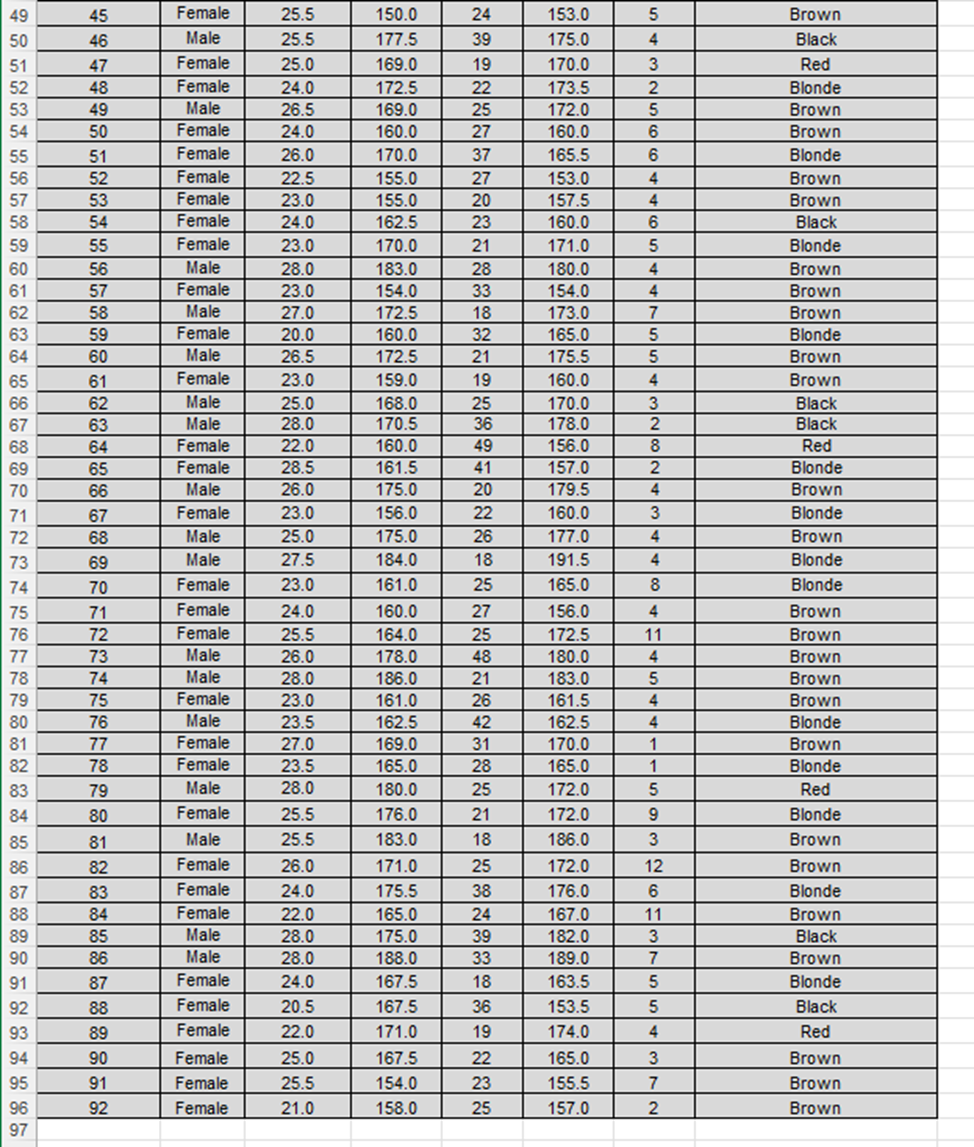
General Instructions: Please place your name above, then complete the following questions. NOTE: Read the entire document below to get a feel for the activity before continuing. Make sure to save this Excel file often using the filename "yournameActivity5(Summer 2024)". Once complete, submit your answers to this activity by attaching your Excel file through the completion link in the Unit 2 Activity 5 assignment description in Blackboard. Use the area to the near right in this Excel worksheet when calculating any statistics/parameters. Methods/work to calculate values must be shown in the spreadsheet in order to receive full credit. Overview As discussed in the Sth and 10th Chapters of your text, one must realize the difficulty of, and issues related to predicting population parameters from sample data (e.g. determine the mean height of all FHSU students but only collect a sample to do s0.) To do this (as covered in Chapter 9), one must understand sampling distributions and the related issue of probability as found through the study of such distributions (which is also the key to truly understanding the rest of the material in the remaining chapters covered.) With knowledge of sampling distributions, one can then predict population parameters from sample statistics and have some indication of the strength of prediction. Do note however, we can never be 100% sure of the true population value based from a sample, we can only be relatively confident the population value is within some interval we build around a collected sample statistic. This activity is designed to have you use the cleaned class data from Activity 4 to predict some population parameters and to discuss issues regarding such predictions. The cleaned data set of 92 values is given to the right (recall that one individual's data was eliminated in Activity 4). Although this is not normally done, the Individual ID#s were also reassigned to eliminate student confusion on the number of data pieces in the data set. . Let's assume that the genders for the class were collected from 92 randomly selected students taking Elements of Statistics at FHSUeven though we know the data was not truly randomly collected but instead comes from a convenience sample of this semester's various vitual sections of the course. a, First, determine from this sample data the proportion [percentage) of students who are male. b. Explain why it would be wrong to use the proportion calculated above (evenif the data came from arandom sample) as the proportion value for ALL FHSU Element of Statistics students who are male. c. Mewt, bazed upon a 30 level of confidence, determine the margin of error in estimating the true population propartion of FHSU Element of Statistics students who are male from this sample data. Give this margin of error value below. Show all work to the right of the problem. 61 | d. Meut use your margin of error value to produce the 30 confidence interval for the population proportion as predicted 62 | from the sample results, State this interval below within an interpretive sentence tied to the given contest, 70 | r 2. Clearly explain the intentimeaning of the \"30:4 number in the confidence interval problem above. 9 r 3. As above, let's assume that the sample data for the age variable was collected from randomly selected students taking Elements 80 | of Statistics from FHSU. 83| a, Using Excel caloulations at the right, determine the mean, median, standard deviation, and variance of the \"age\" 89 | b. Determine the margin of emror in estimating the population mean age from this one sample's mean based upon a 353 90 | level of confidence. (Youmay assume that previous research has demonstrated the population standard deviation 9 on age measures of similar groups of students is 10.1years and that the distribution of age measures is roughly a 32 | normal distribution. ] 100 | 101 | 102 | 103 104 | . Using your margin of error value from [3b), give the 954 confidence interval for the population mean age measure as 105 predicted from this sample's results. State this interval below within an interpretive sentence. 106 | 107 | 108 09 m d. Although similar, what makes this situation in problem #3 (and hence some of the resulting statistical formulas used) 112 113 different from the situation in problem #1 above? 114 115 116 117 118 119 120 4. Notice (from the margin of error measurement determined in 3b] that we have used a sample size larger than needed to be 121 sufficiently confident that the sample mean would estimate the population mean age within 4 years; that is our margin of error was 122 much smaller than 4. Therefore. determine the smallest sample size required to predict the mean age of all FHSU stats 123 students based upon a needed 95%% confidence level with an error of no more than 4 years. (Again, assume = 10.1years.) 124 125 126 127 128 Notice that 4 is roughly double our margin of error of 2.063837746 from problem 3b above. Are you surprised that it took so small a 130 sample to double the margin of error? (Notice we do not "double" our margin of error by "halving" the sample size.) How many times 131 132 smaller must the sample size be in order to double the margin of error? 133 134 135 136 137 138 5. Lastly, although the procedure in #3 above was convenient, in most cases if we are trying to predict the population mean from a 139 sample mean, we will most likely not know the population standard deviation, sigma. Thus, our next best statistic to use is the sample 140 standard deviation in its place. However, when using the sample standard deviation, we are no longer able to use a normal 141 distribution, and must use the t-distribution instead. 142 143 Determine the margin of error in estimating the population mean age from this one sample's mean based upon a 98% 144 level of confidence. Do not use our earlier assumption of sigma = 10.1 years, but use the sample standard deviation 145 value you calculated in 3a, along with a / -score instead of a 5 -score. 146 147 148 149 150 b. Using your margin of error value from (5a), give the 98%% confidence interval for the population mean age measure as 151 predicted from this sample's results. State this interval below within an interpretive sentence. 152 153 154 155 1562 MATH 250- Elements of Statistics 3 Class Data, Summer 2024---CLEANED Student Data (renumbered 1-92) Number Foot in Individual ID# Gender Length Height Age Armspan Family Hair Color Female 25.5 145.0 36 143.0 4 Brown Female 24.5 180.0 41 184.5 4 Red Female 23.5 161.5 29 163.0 Brown Female 24.5 160.0 48 161.5 8 Brown Female 24.0 170.0 36 172.0 5 Brown Male 27.0 183.0 27 182.0 4 Brown Male 26.5 172.5 21 172.5 5 Blonde Female 25.5 142.0 23 145.0 5 Brown Male 26.5 180.0 23 180.0 4 Brown Male 25.0 172.5 50 179.0 10 Brown Male 23.0 182.5 21 180.0 3 Black Female 22.5 159.0 29 160.0 9 Blonde Male 25.5 168.0 28 166.5 Brown Female 23.0 159.0 33 157.5 Brown Female 23.0 160.0 23 156.0 Brown Male 26.0 179.0 42 184.0 Brown Male 28.0 189.0 28 187.0 Brown Female 23.0 162.5 37 163.0 6 Brown Female 23.0 181.0 24 174.0 Red Female 20.0 160. 20 154.0 5 Brown Female 22.0 157.5 34 162.0 Brown Female 23.5 169.0 27 169.0 Red Female 24.0 162.5 27 164.5 Blonde Female 26.5 152.5 38 157.5 Brown Female 23.0 163.0 32 165.0 2 Brown Female 25.0 167.5 30 165.0 Brown Female 24.5 157.5 26 153.0 3 Brown Female 25.5 149.5 37 151.5 12 Blonde Female 21.5 157.5 34 158.0 5 Brown Female 25.5 165.0 19 169.0 Brown Female 25.5 170.0 24 168.0 4 Purple Female 21.0 167.0 24 156.0 Black Female 24.0 170.0 20 170.0 Blonde Male 29.5 188.0 34 189.5 Blonde Female 25.0 177.0 41 173.0 Blonde Male 30.0 185.5 31 183.0 Black Male 26.5 179.5 31 177.5 3 Brown Female 25.0 170.0 45 168.0 3 Blonde Male 28.0 187. 21 188.0 7 Black 40 Female 23.0 163.0 28 164.0 3 Red 41 Male 24.5 181.0 38 183.0 4 Brown 42 Female 23.5 166.5 29 169.5 Brown 43 Male 24.5 178.0 34 176.5 Brown 44 Female 24.0 167.0 18 167.0 3 Brown 45 Female 25.5 150.0 24 153.0 5 Brown45 Female 25.5 150.0 24 153.0 5 Brown 46 Male 25.5 177.5 39 175.0 Black 47 Female 25.0 169.0 19 170.0 Red 48 Female 24.0 172.5 22 173.5 Blonde 49 Male 26.5 169.0 25 172.0 Brown 50 Female 24.0 160.0 27 160.0 Brown 51 Female 26.0 170.0 37 165.5 6 Blonde 52 Female 22.5 155.0 27 153.0 4 Brown 53 Female 23.0 155.0 20 157.5 Brown Female 24.0 162.5 23 160.0 Black Female 23.0 170.0 21 171.0 Blonde Male 28.0 183.0 28 180.0 Brown Female 23.0 154.0 33 154.0 Brown Male 27.0 172.5 18 173.0 Brown BEEN 8889828828848488986 59 Female 20.0 160.0 32 165.0 Blonde 60 Male 26.5 172.5 21 175.5 Brown 61 Female 23.0 159.0 19 160.0 Brown 62 Male 25.0 168.0 25 170.0 Black 63 Male 28.0 170.5 36 178.0 Black 64 Female 22.0 160.0 49 156.0 Red 65 Female 28.5 161.5 41 157.0 Blonde 66 Male 26.0 175.0 20 179.5 Brown 67 Female 23.0 156.0 22 160.0 Blonde 68 Male 25.0 175.0 26 177.0 Brown 69 Male 27.5 184.0 18 191.5 Blonde 70 Female 23.0 161.0 25 165.0 8 Blonde 71 Female 24.0 160.0 27 156.0 Brown 72 Female 25.5 164.0 25 172.5 11 Brown 73 Male 26.0 178.0 48 180.0 Brown 74 Male 28.0 186.0 21 183.0 5 Brown 75 Female 23.0 161.0 26 161.5 Brown 76 Male 23.5 162.5 42 162.5 Blonde 77 Female 27.0 169.0 31 170.0 1 Brown 78 Female 23.5 165.0 28 165.0 -1 Blonde 79 Male 28.0 180.0 25 172.0 5 Red 80 Female 25.5 176.0 21 172.0 9 Blonde 81 Male 25.5 183.0 18 186.0 3 Brown 8288898828 89860 82 Female 26.0 171.0 25 172.0 12 Brown 83 Female 24.0 175.5 38 176.0 6 Blonde 84 Female 22.0 165.0 24 167.0 11 Brown 85 Male 28.0 175.0 39 182.0 3 Black 86 Male 28.0 188.0 33 189.0 7 Brown 87 Female 24.0 167.5 18 163.5 5 Blonde 88 Female 20.5 167.5 36 153.5 5 Blac 89 Female 22.0 171.0 19 174.0 Red 90 Female 25.0 167.5 22 165.0 3 Brown 91 25.5 23 155.5 98 8 2 Female 154.0 7 Brown 92 Female 21.0 158.0 25 157.0 2 Brown
Step by Step Solution
There are 3 Steps involved in it
Step: 1
Get Instant Access to Expert-Tailored Solutions
See step-by-step solutions with expert insights and AI powered tools for academic success
Step: 2
Step: 3
Ace Your Homework with AI
Get the answers you need in no time with our AI-driven, step-by-step assistance