Answered step by step
Verified Expert Solution
Question
1 Approved Answer
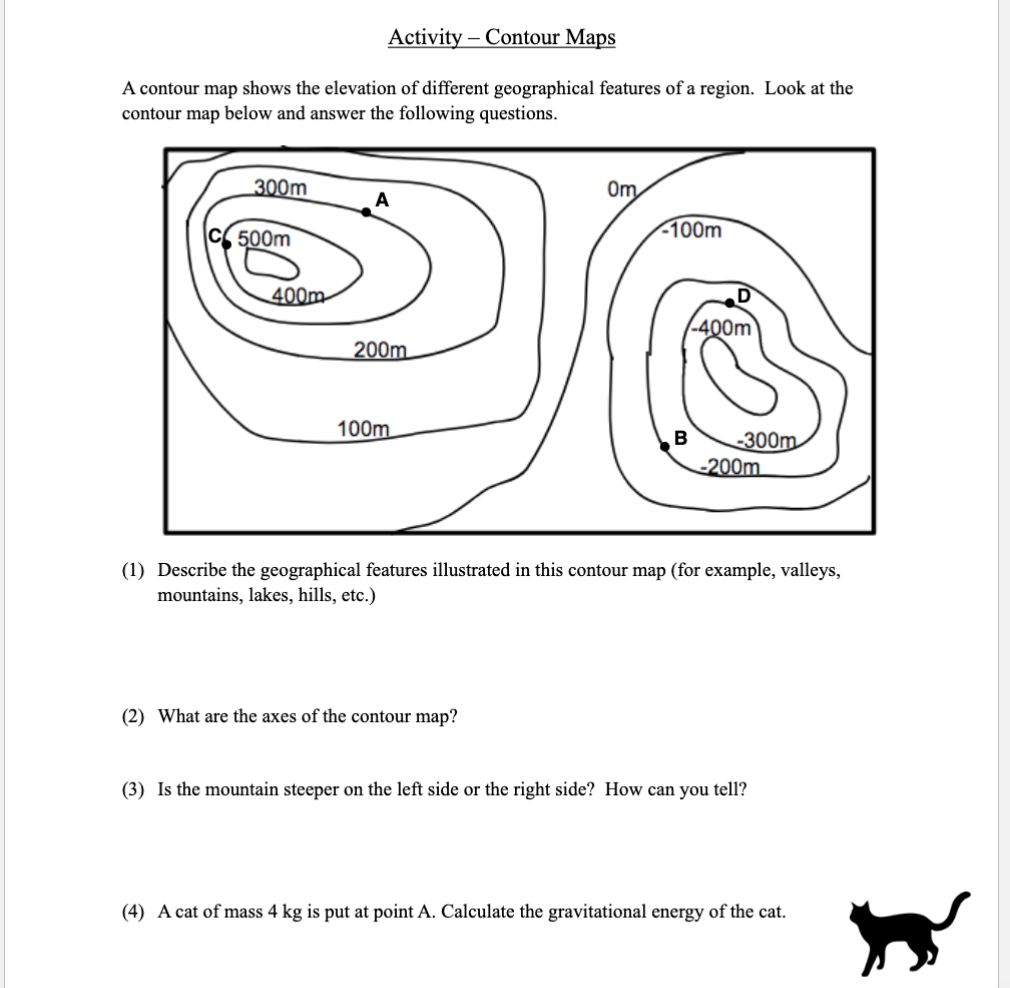
Activity Contour Maps A contour map shows the elevation of different geographical features of a region. Look at the contour map below and answer


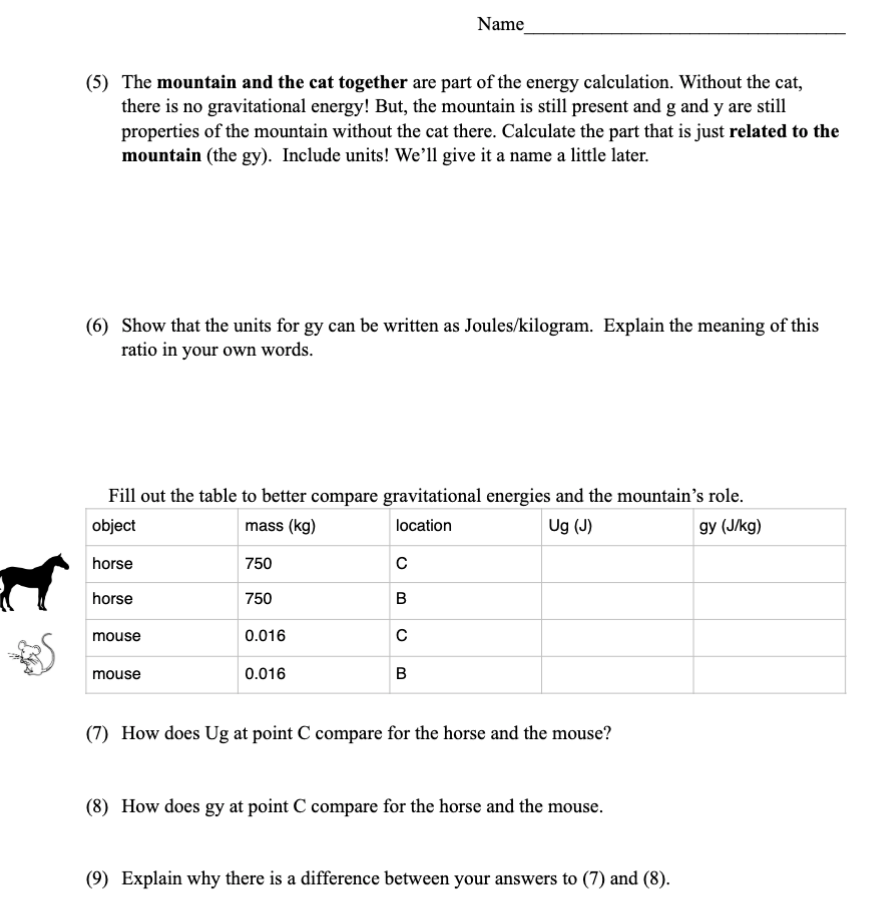
Activity Contour Maps A contour map shows the elevation of different geographical features of a region. Look at the contour map below and answer the following questions. 300m A C500m 400m 200m 100m Om 100m D -400m B -300m -200m (1) Describe the geographical features illustrated in this contour map (for example, valleys, mountains, lakes, hills, etc.) (2) What are the axes of the contour map? (3) Is the mountain steeper on the left side or the right side? How can you tell? (4) A cat of mass 4 kg is put at point A. Calculate the gravitational energy of the cat. Name (5) The mountain and the cat together are part of the energy calculation. Without the cat, there is no gravitational energy! But, the mountain is still present and g and y are still properties of the mountain without the cat there. Calculate the part that is just related to the mountain (the gy). Include units! We'll give it a name a little later. (6) Show that the units for gy can be written as Joules/kilogram. Explain the meaning of this ratio in your own words. Fill out the table to better compare gravitational energies and the mountain's role. object mass (kg) location horse 750 C horse 750 B mouse 0.016 C mouse 0.016 B Ug (J) (7) How does Ug at point C compare for the horse and the mouse? (8) How does gy at point C compare for the horse and the mouse. (9) Explain why there is a difference between your answers to (7) and (8). gy (J/kg)
Step by Step Solution
There are 3 Steps involved in it
Step: 1

Get Instant Access to Expert-Tailored Solutions
See step-by-step solutions with expert insights and AI powered tools for academic success
Step: 2

Step: 3

Ace Your Homework with AI
Get the answers you need in no time with our AI-driven, step-by-step assistance
Get Started


