Answered step by step
Verified Expert Solution
Link Copied!

Question

1 Approved Answer

Activity on Presentation of Data and Computation of Mean A. Explore the Microsoft excel in terms of presenting data through graphs. B. Gather data available
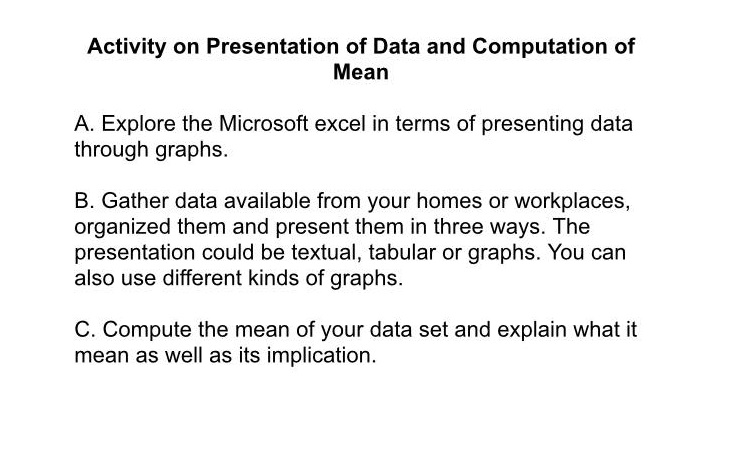
image text in transcribed
Activity on Presentation of Data and Computation of Mean A. Explore the Microsoft excel in terms of presenting data through graphs. B. Gather data available from your homes or workplaces, organized them and present them in three ways. The presentation could be textual. tabular or graphs. You can also use different kinds of graphs. C. Compute the mean of your data set and explain what it mean as well as its implication

Step by Step Solution

There are 3 Steps involved in it

Step: 1

blur-text-image

Get Instant Access to Expert-Tailored Solutions

See step-by-step solutions with expert insights and AI powered tools for academic success

Step: 2

blur-text-image_2

Step: 3

blur-text-image_3

Ace Your Homework with AI

Get the answers you need in no time with our AI-driven, step-by-step assistance

Get Started

Recommended Textbook for

Finite Mathematics

Authors: Stefan Waner, Steven Costenoble

6th Edition

1285415604, 9781285415604

More Books

Students also viewed these Mathematics questions

Question

What is linear transformation? Define with example

Answered: 1 week ago