Answered step by step
Verified Expert Solution
Question
1 Approved Answer
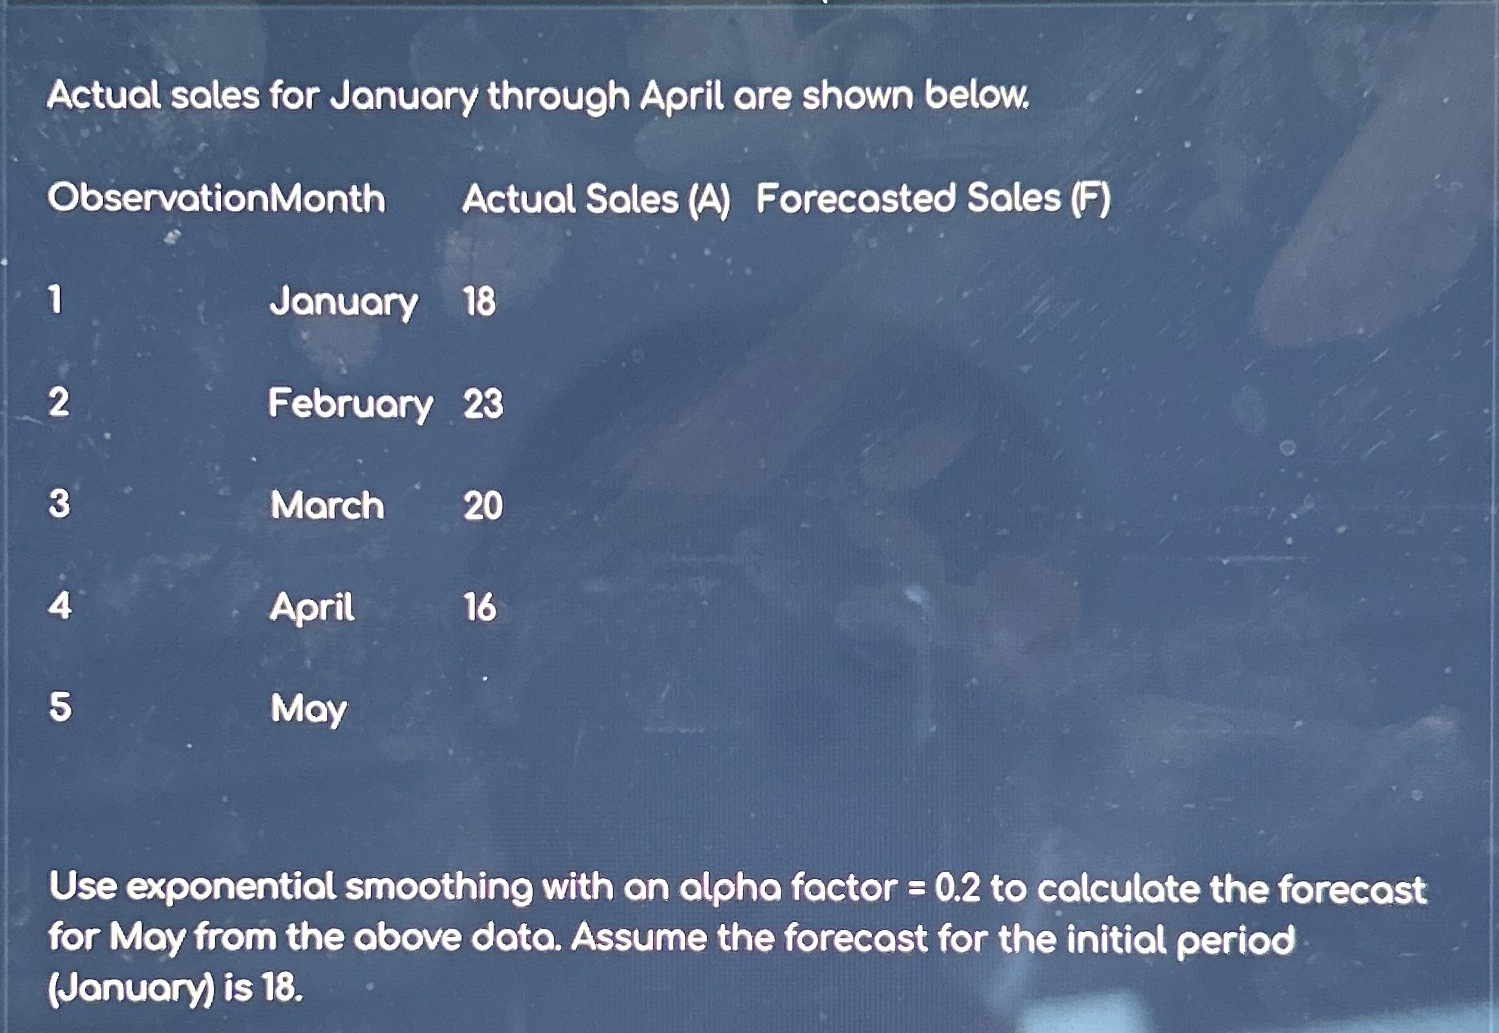
Actual sales for January through April are shown below. table [ [ ObservationMonth , Actual Sales ( A ) Forecasted Sales ( F )
Actual sales for January through April are shown below.
tableObservationMonthActual Sales A Forecasted Sales FJanuary February March April May
Use exponential smoothing with an alpha factor to calculate the forecast for Moy from the above data. Assume the forecast for the initial period January is

Step by Step Solution
There are 3 Steps involved in it
Step: 1

Get Instant Access to Expert-Tailored Solutions
See step-by-step solutions with expert insights and AI powered tools for academic success
Step: 2

Step: 3

Ace Your Homework with AI
Get the answers you need in no time with our AI-driven, step-by-step assistance
Get Started


