Answered step by step
Verified Expert Solution
Question
1 Approved Answer
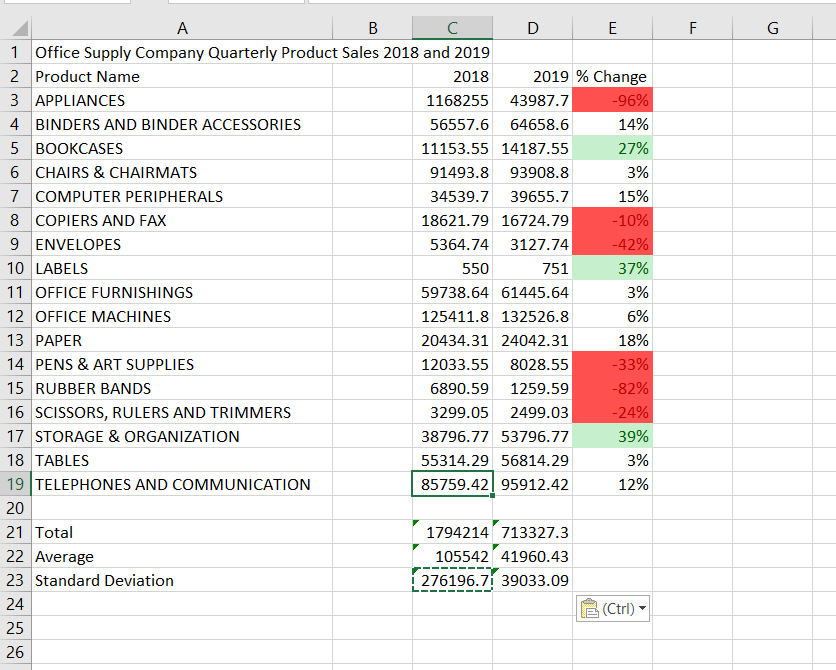
Add a new column to calculate the percentage change from 2017 to 2018. Percentage change is computed using the following formula: (current year sales -

- Add a new column to calculate the percentage change from 2017 to 2018. Percentage change is computed using the following formula: (current year sales - last year sales) / (last year sales). Represent the numbers as percentages
I my excel sheet that my instructor gave us does not have sales of 2017.
F G - B D E Office Supply Company Quarterly Product Sales 2018 and 2019 2 Product Name 2018 2019 % Change APPLIANCES 1168255 43987.7 -96% 4. BINDERS AND BINDER ACCESSORIES 56557.6 64658.6 14% 5 BOOKCASES 11153.55 14187.55 27% 6 CHAIRS & CHAIRMATS 91493.8 93908.8 3% COMPUTER PERIPHERALS 34539.7 39655.7 15% 8 COPIERS AND FAX 18621.79 16724.79 -10% 9 ENVELOPES 5364.74 3127.74 -42% 10 LABELS 550 751 37% 11 OFFICE FURNISHINGS 59738.64 61445.64 3% 12 OFFICE MACHINES 125411.8 132526.8 13 PAPER 20434.31 24042.31 18% 14 PENS & ART SUPPLIES 12033.55 8028.55 15 RUBBER BANDS 6890.59 1259.59 16 SCISSORS, RULERS AND TRIMMERS 3299.05 2499.03 -24% 17 STORAGE & ORGANIZATION 38796.77 53796.77 39% 18 TABLES 55314.29 56814.29 3% 19 TELEPHONES AND COMMUNICATION 85759.42 95912.42 12% 6% -33% -82% 20 21 Total 22 Average 23 Standard Deviation 1794214 713327.3 105542 41960.43 276196.7 39033.09 & (Ctrl) F G - B D E Office Supply Company Quarterly Product Sales 2018 and 2019 2 Product Name 2018 2019 % Change APPLIANCES 1168255 43987.7 -96% 4. BINDERS AND BINDER ACCESSORIES 56557.6 64658.6 14% 5 BOOKCASES 11153.55 14187.55 27% 6 CHAIRS & CHAIRMATS 91493.8 93908.8 3% COMPUTER PERIPHERALS 34539.7 39655.7 15% 8 COPIERS AND FAX 18621.79 16724.79 -10% 9 ENVELOPES 5364.74 3127.74 -42% 10 LABELS 550 751 37% 11 OFFICE FURNISHINGS 59738.64 61445.64 3% 12 OFFICE MACHINES 125411.8 132526.8 13 PAPER 20434.31 24042.31 18% 14 PENS & ART SUPPLIES 12033.55 8028.55 15 RUBBER BANDS 6890.59 1259.59 16 SCISSORS, RULERS AND TRIMMERS 3299.05 2499.03 -24% 17 STORAGE & ORGANIZATION 38796.77 53796.77 39% 18 TABLES 55314.29 56814.29 3% 19 TELEPHONES AND COMMUNICATION 85759.42 95912.42 12% 6% -33% -82% 20 21 Total 22 Average 23 Standard Deviation 1794214 713327.3 105542 41960.43 276196.7 39033.09 & (Ctrl)Step by Step Solution
There are 3 Steps involved in it
Step: 1

Get Instant Access to Expert-Tailored Solutions
See step-by-step solutions with expert insights and AI powered tools for academic success
Step: 2

Step: 3

Ace Your Homework with AI
Get the answers you need in no time with our AI-driven, step-by-step assistance
Get Started


