Answered step by step
Verified Expert Solution
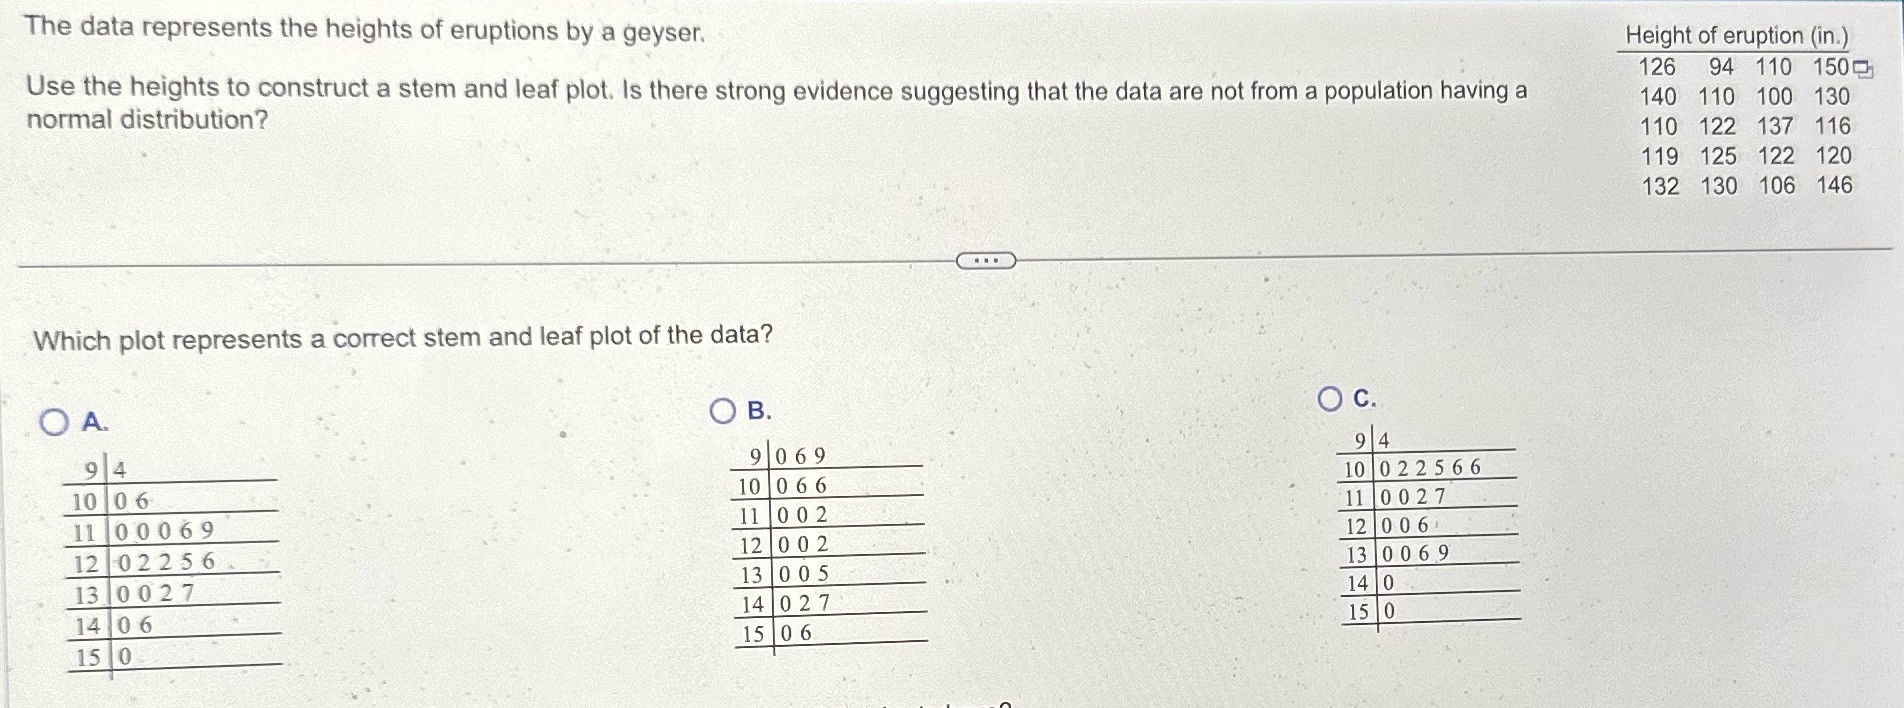
Link Copied!

Question

1 Approved Answer

Additional question: if there were a 200 foot eruption, how many stems would it add to the chart above? A. 1B. 5C. 4D. 6 The

Additional question: if there were a 200 foot eruption, how many stems would it add to the chart above? A. 1B. 5C. 4D. 6

image text in transcribed
The data represents the heights of eruptions by a geyser. Height of eruption (in.) 126 94 110 150 normal distribution? Use the heights to construct a stem and leaf plot. Is there strong evidence suggesting that the data are not from a population having a 140 110 100 130 110 122 137 116 119 125 122 120 132 130 106 146 Which plot represents a correct stem and leaf plot of the data? O A. O B. O C. 9 4 9 069 9 4 10 06 10 06 6 10 02 2 5 6 6 11 0 0069 11 0 02 11 0 027 12 02256 12 0 02 12 0 06 13 0 027 13 0 05 13 0 069 14 0 2 7 14 0 14 06 15 0 15 06 15 0

Step by Step Solution

There are 3 Steps involved in it

Step: 1

blur-text-image

Get Instant Access to Expert-Tailored Solutions

See step-by-step solutions with expert insights and AI powered tools for academic success

Step: 2

blur-text-image

Step: 3

blur-text-image

Ace Your Homework with AI

Get the answers you need in no time with our AI-driven, step-by-step assistance

Get Started

Recommended Textbook for

Contemporary Business Mathematics With Canadian Applications

Authors: Ali R. Hassanlou, S. A. Hummelbrunner, Kelly Halliday

12th Edition

0135285011, 978-0135285015

More Books

Students also viewed these Mathematics questions

Question

What external environmental factors affect Nestle and why?

Answered: 1 week ago