Answered step by step
Verified Expert Solution
Link Copied!

Question

1 Approved Answer

Additional questions to the attached question. In the long run, over which range of output levels does Ike's Bikes experience constant average cost? (a) Between

Additional questions to the attached question.

In the long run, over which range of output levels does Ike's Bikes experience constant average cost?

(a) Between 300 and 400 bikes per month

(b) More than 400 bikes per month

(c) Fewer than 300 bikes per month
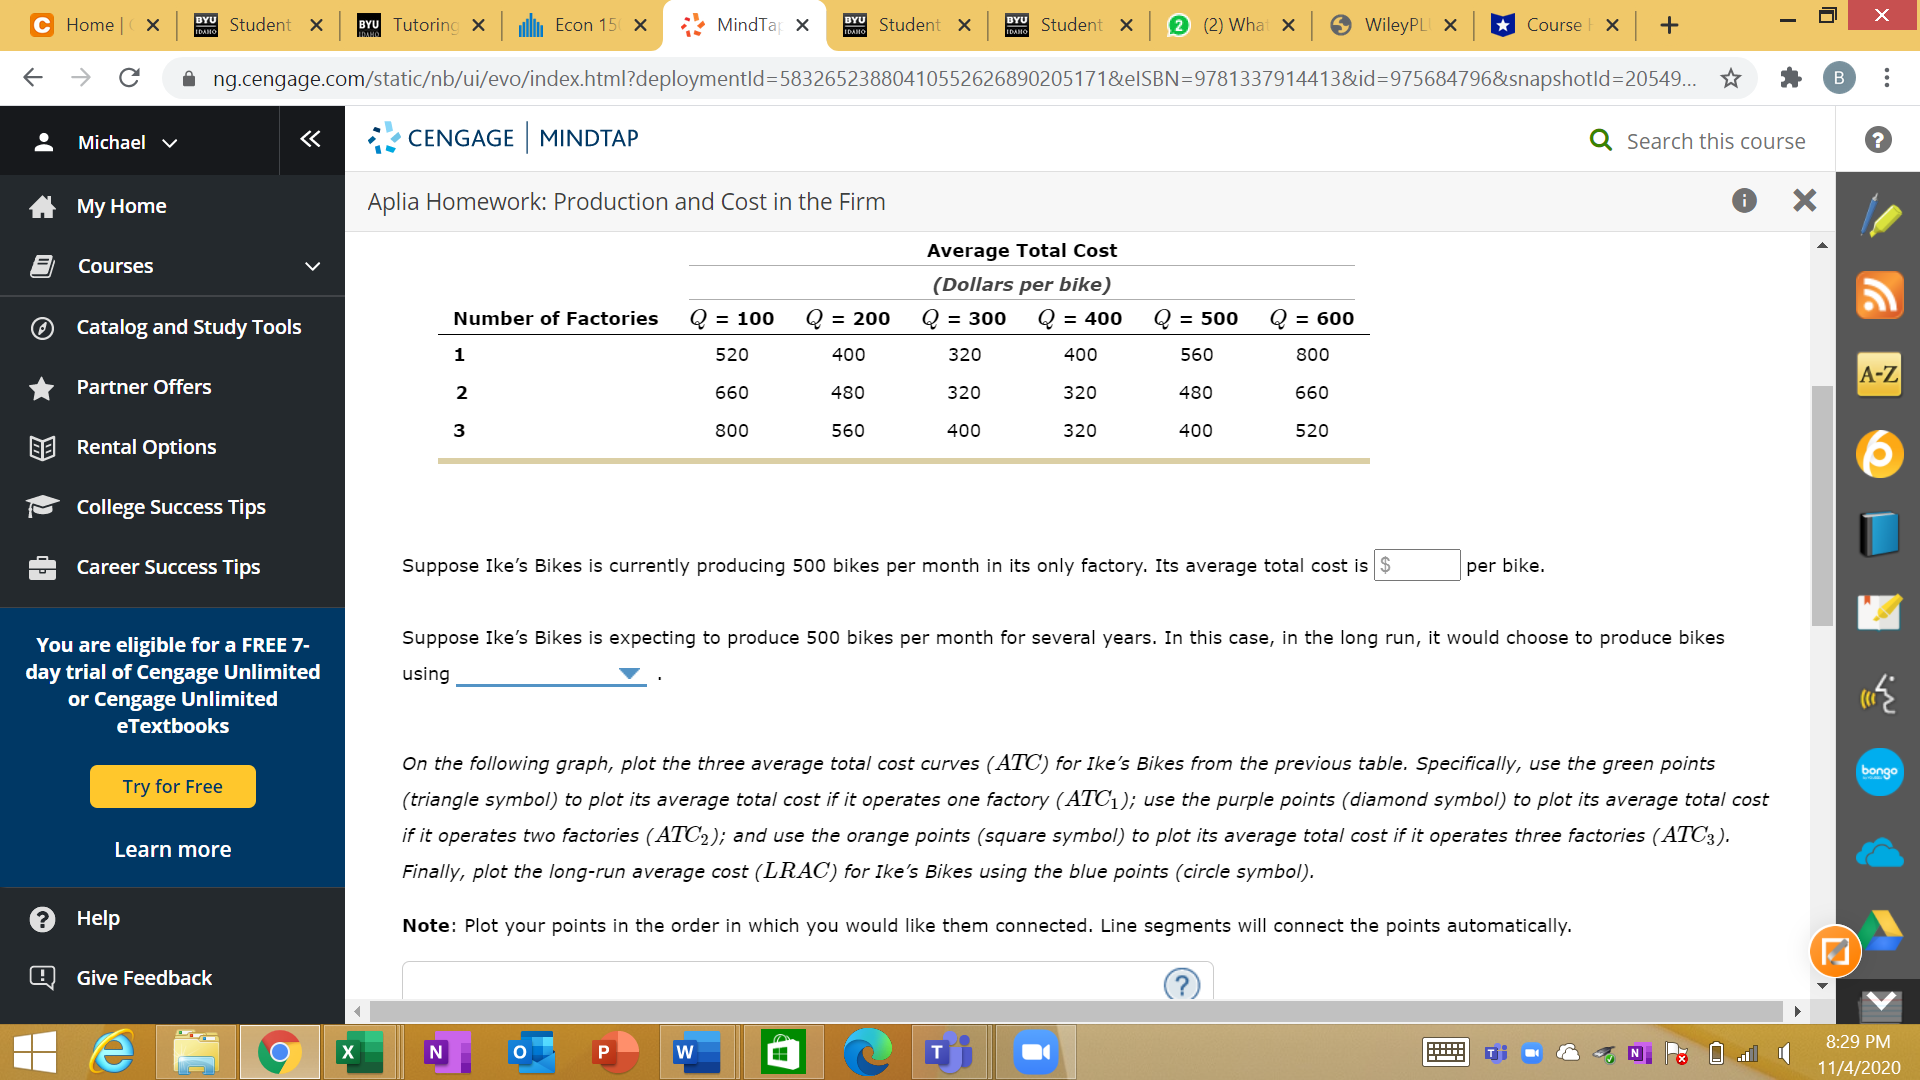
image text in transcribed
C Home |( X X Student X BYU Tutoring X Econ 15( X MindTar X X Student X BYU Student X 2 (2) What X WileyPLI X Course I X + X A ng.cengage.com/staticb/ui/evo/index.html?deploymentld=58326523880410552626890205171&elSBN=9781337914413&id=975684796&snapshotld=20549... B . . . Michael v CENGAGE | MINDTAP Q Search this course ? My Home Aplia Homework: Production and Cost in the Firm X Courses Average Total Cost (Dollars per bike) Catalog and Study Tools Number of Factories Q = 100 Q = 200 Q = 300 Q = 400 Q = 500 Q = 600 1 520 400 320 400 560 800 Partner Offers W N 660 480 320 320 480 660 A-Z Rental Options 800 560 400 320 400 520 College Success Tips Career Success Tips Suppose Ike's Bikes is currently producing 500 bikes per month in its only factory. Its average total cost is $ per bike. You are eligible for a FREE 7- Suppose Ike's Bikes is expecting to produce 500 bikes per month for several years. In this case, in the long run, it would choose to produce bikes day trial of Cengage Unlimited using or Cengage Unlimited eTextbooks Try for Free On the following graph, plot the three average total cost curves ( ATC) for Ike's Bikes from the previous table. Specifically, use the green points bongo (triangle symbol) to plot its average total cost if it operates one factory (ATC1); use the purple points (diamond symbol) to plot its average total cost Learn more if it operates two factories ( ATC2); and use the orange points (square symbol) to plot its average total cost if it operates three factories ( ATC3). Finally, plot the long-run average cost (LRAC) for Ike's Bikes using the blue points (circle symbol). ? Help Note: Plot your points in the order in which you would like them connected. Line segments will connect the points automatically. Give Feedback (? e X N O W T 8:29 PM 11/4/2020

Step by Step Solution

There are 3 Steps involved in it

Step: 1

blur-text-image

Get Instant Access to Expert-Tailored Solutions

See step-by-step solutions with expert insights and AI powered tools for academic success

Step: 2

blur-text-image

Step: 3

blur-text-image

Ace Your Homework with AI

Get the answers you need in no time with our AI-driven, step-by-step assistance

Get Started

Recommended Textbook for

International Economics Theory and Policy

Authors: Paul R. Krugman, Maurice Obstfeld, Marc J. Melitz

9th Edition

978-0132146654, 0132146657, 9780273754091, 978-0273754206

More Books

Students also viewed these Economics questions

Question

1. Identify an organization to analyze, preferably your employer.

Answered: 1 week ago