Answered step by step
Verified Expert Solution
Question
1 Approved Answer
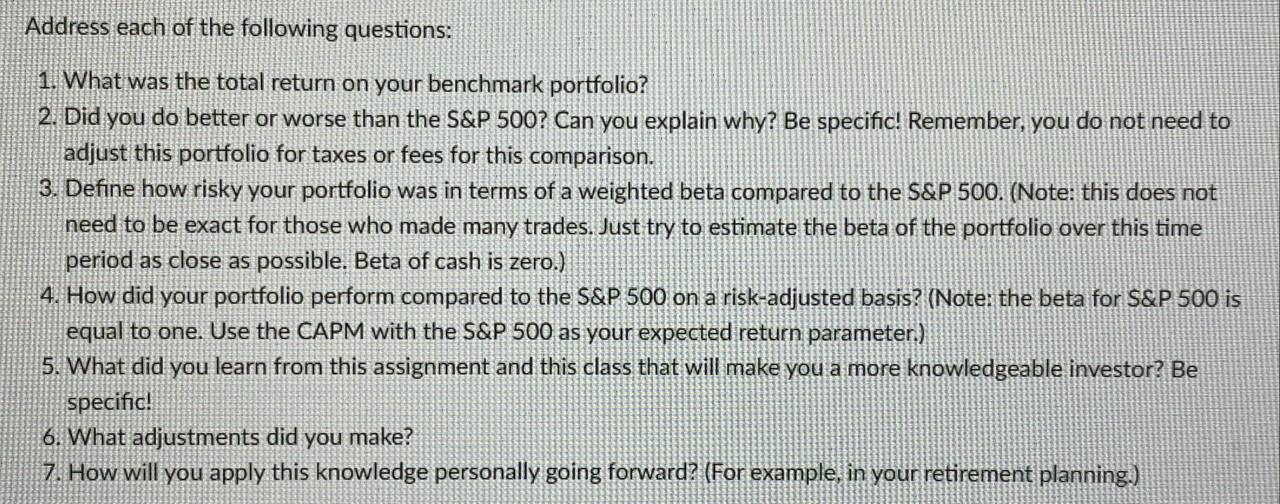
Address each of the following questions: 1. What was the total return on your benchmark portfolio? 2. Did you do better or worse than


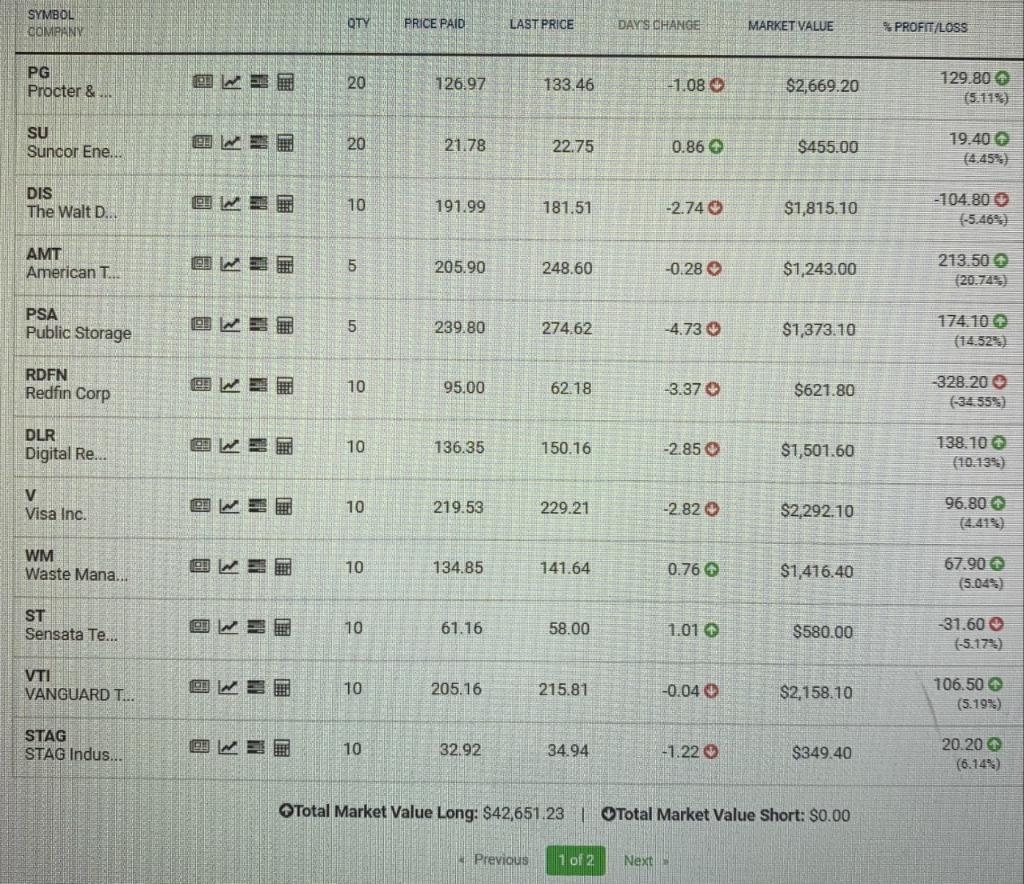
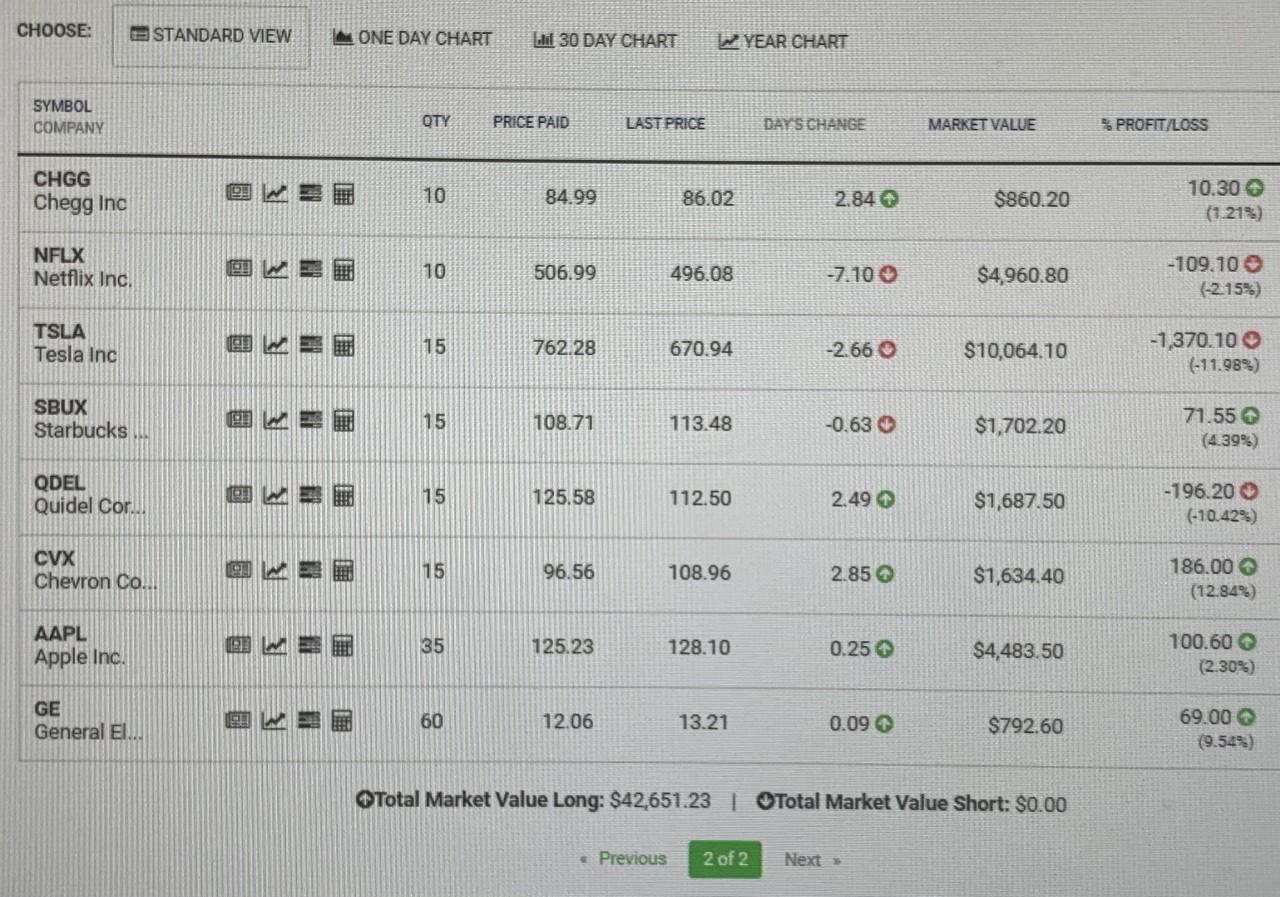
Address each of the following questions: 1. What was the total return on your benchmark portfolio? 2. Did you do better or worse than the S&P 500? Can you explain why? Be specific! Remember, you do not need to adjust this portfolio for taxes or fees for this comparison. 3. Define how risky your portfolio was in terms of a weighted beta compared to the S&P 500. (Note: this does not need to be exact for those who made many trades. Just try to estimate the beta of the portfolio over this time period as close as possible. Beta of cash is zero.) 4. How did your portfolio perform compared to the S&P 500 on a risk-adjusted basis? (Note: the beta for S&P 500 is equal to one. Use the CAPM with the S&P 500 as your expected return parameter.) 5. What did you learn from this assignment and this class that will make you a more knowledgeable investor? Be specific! 6. What adjustments did you make? 7. How will you apply this knowledge personally going forward? (For example, in your retirement planning.) SYMBOL COMPANY PG Procter &... SU Suncor Ene... DIS The Walt D... AMT American T... PSA Public Storage RDFN Redfin Corp DLR Digital Re... V Visa Inc. WM Waste Mana... ST Sensata Te... VTI VANGUARD T... STAG STAG Indus... KEM WIE WER WET KET OW== OKET WET QTY 20 20 10 5 5 10 10 10 10 10 10 10 PRICE PAID 126.97 21.78 191.99 205.90 239.80 95.00 136.35 219.53 134.85 61.16 205.16 32.92 LAST PRICE 133.46 Previous 22.75 181.51 248.60 274.62 62.18 150.16 229.21 141.64 58.00 215.81 34.94 DAY'S CHANGE 1 of 2 -1.08 Next 0.86 -2.740 -0.28 -4.730 -3.37 -2.850 -2.820 0.76 1.01 -0.04 -1.22 MARKET VALUE $2,669.20 $455.00 $1,815.10 $1,243.00 $1,373.10 $621.80 $1,501.60 $2,292.10 $1,416.40 $580.00 Total Market Value Long: $42,651.23 | Total Market Value Short: $0.00 $2,158.10 $349.40 % PROFIT/LOSS 129.800 (5.11%) 19.40 -104.800 (-5.46%) 213.500 (20.74%) 174.100 (14.52%) -328.20 (-34.55%) 138.10 (10.13%) 96.80 67.90 (5.04%) -31.600 (-5.17%) 106.50 (5.19%) 20.20 (6.14%) CHOOSE: SYMBOL COMPANY CHGG Chegg Inc NFLX Netflix Inc. TSLA Tesla Inc SBUX Starbucks... QDEL Quidel Cor... CVX Chevron Co... AAPL Apple Inc. STANDARD VIEW GE General El.. KET MET WIT WEE WET WET ONE DAY CHART QTY 10 10 15 15 15 15 35 60 30 DAY CHART PRICE PAID 84.99 506.99 762.28 108.71 125.58 96.56 125.23 12.06 LAST PRICE 86.02 Previous 496.08 670.94 113.48 112.50 108.96 128.10 13.21 YEAR CHART DAY'S CHANGE 2 of 2 2.84 + -7.100 -2.66 -0.63 2.49 2.850 0.25 0.09 MARKET VALUE Next >> $860.20 $4,960.80 $10,064.10 $1,702.20 $1,687.50 $1,634.40 Total Market Value Long: $42,651.23 | Total Market Value Short: $0.00 $4,483.50 $792.60 % PROFIT/LOSS 10.30- (1.21%) -109.10 - (-2.15%) -1,370.10 (-11.98%) 71.55 (4.39%) -196.20 (-10.42%) 186.00 (12.84%) 100.60 (2.30%) 69.00 (9.54%)
Step by Step Solution
There are 3 Steps involved in it
Step: 1
1 Total return on benchmark portfolio STEP 1 calculation of total investment 20126972021...
Get Instant Access to Expert-Tailored Solutions
See step-by-step solutions with expert insights and AI powered tools for academic success
Step: 2

Step: 3

Ace Your Homework with AI
Get the answers you need in no time with our AI-driven, step-by-step assistance
Get Started


