

Answered step by step
Verified Expert Solution
Question
1 Approved Answer
a)Draw aPb,lnPb, and PbvsXPb. Integrate graphically the Gibbs-Duhem equation and plot aAg and lnAg vs XPb b) Fit a curve to lnlnPbvSXPb, different than the
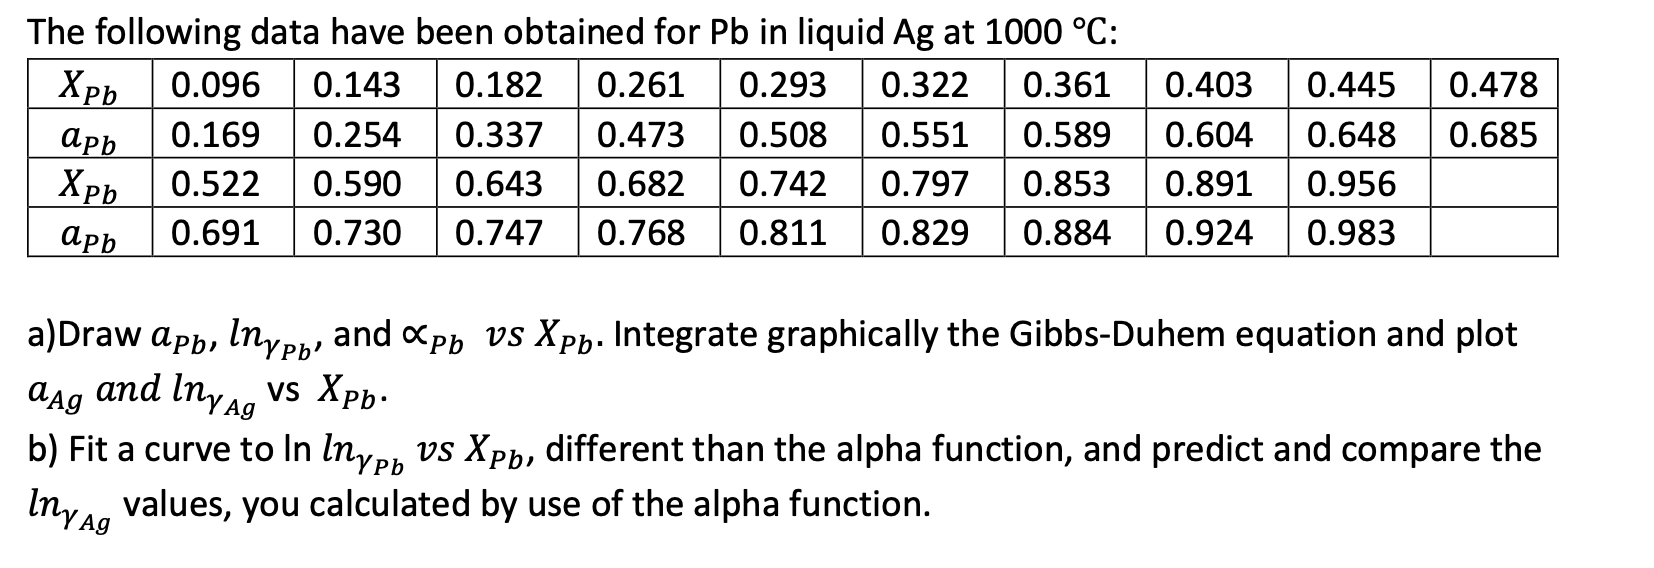 a)Draw aPb,lnPb, and PbvsXPb. Integrate graphically the Gibbs-Duhem equation and plot aAg and lnAg vs XPb b) Fit a curve to lnlnPbvSXPb, different than the alpha function, and predict and compare the lnAg values, you calculated by use of the alpha function
 Step by Step Solution
There are 3 Steps involved in it
Step: 1

Get Instant Access to Expert-Tailored Solutions
See step-by-step solutions with expert insights and AI powered tools for academic success
Step: 2

Step: 3
Ace Your Homework with AI
Get the answers you need in no time with our AI-driven, step-by-step assistance
Get Started
Bioprocess Engineering Basic Concepts
Authors: Michael Shuler, Fikret Kargi, Matthew DeLisa
3rd Edition
0137062702, 978-0137062706