Advanced Chemical Engineering Problem!
Please answer this question as soon as possible with specific explanation.
If you're going to write it in handwriting, please write it clearly so I can recognize it. I don't want you to write solution in cursive letter.
I can give you thumbs up when your answer is correct.
Thanks.


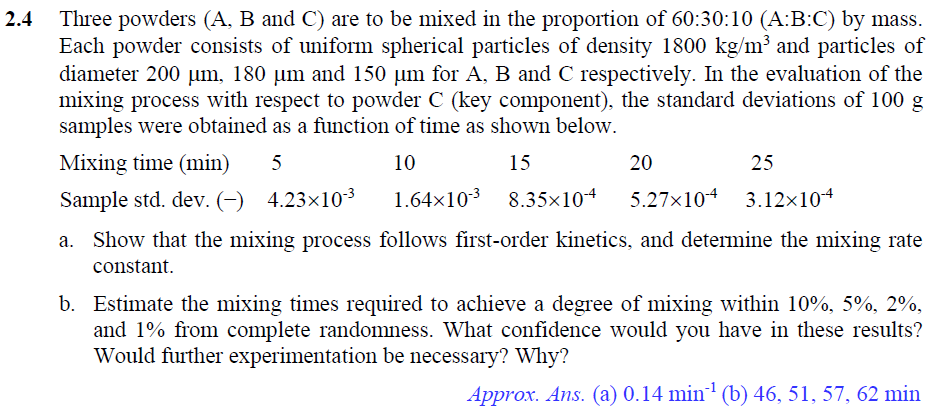
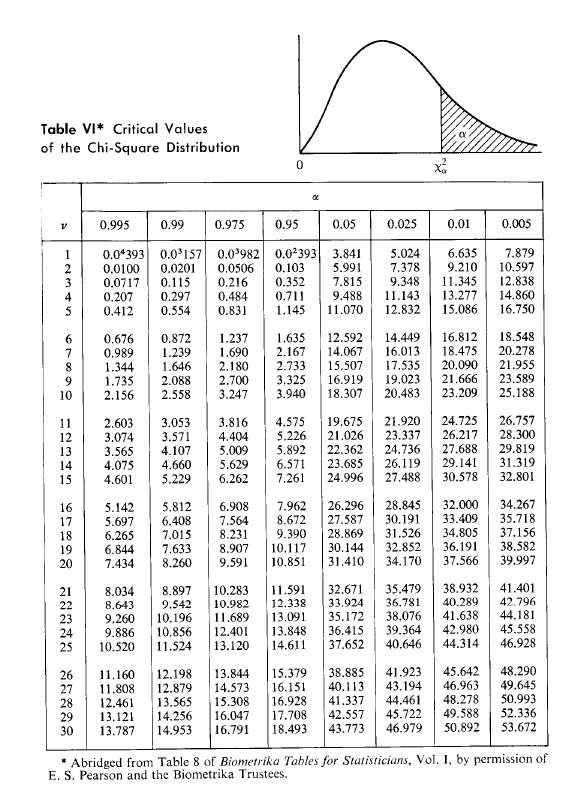
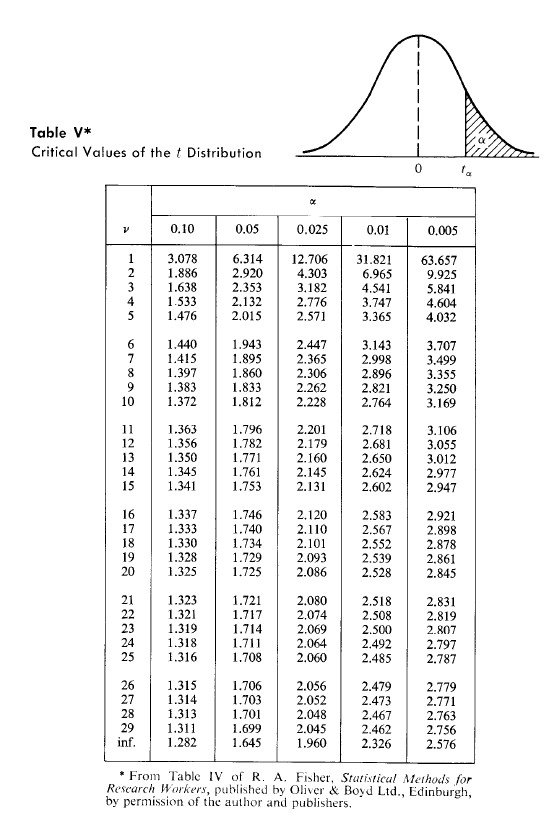
2.4 Three powders (A, B and C) are to be mixed in the proportion of 60:30:10 (A:B:C) by mass. Each powder consists of uniform spherical particles of density 1800 kg/m and particles of diameter 200 um, 180 um and 150 um for A, B and C respectively. In the evaluation of the mixing process with respect to powder C (key component), the standard deviations of 100 g samples were obtained as a function of time as shown below. Mixing time (min) 5 10 15 20 25 Sample std. dev. (-) 4.23x10⁻³ 1.64x10³ 8.35x10⁻⁴ 5.27x10⁻⁴ 3.12x10⁻⁴ a. Show that the mixing process follows first-order kinetics, and determine the mixing rate constant. b. Estimate the mixing times required to achieve a degree of mixing within 10%, 5%, 2%, and 1% from complete randomness. What confidence would you have in these results? Would further experimentation be necessary? Why? Approx. Ans. (a) 0.14 min? (b) 46, 51, 57, 62 min Table VI* Critical Values of the Chi-Square Distribution 0 x2 a V 0.995 0.99 0.975 0.95 0.05 0.025 0.01 0.005 1 2 U UN 0,04393 0.0100 0.0717 0.207 0.412 0.0*157 0.03982 0.0201 0.0506 0.115 0.216 0.297 0.484 0.554 0.831 0.02393 0.103 0.352 0.711 1.145 3.841 5.991 7.815 9.488 11.070 5.024 7.378 9.348 11.143 12.832 6.635 9.210 11.345 13.277 15.086 7.879 10.597 12.838 14.860 16.750 4 5 6 7 8 9 10 0.676 0.989 1.344 1.735 2.156 0.872 1.239 1.646 2.088 2.558 1.237 1.690 2.180 2.700 3.247 1.635 2.167 2.733 3.325 3.940 12.592 14.067 15.507 16.919 18.307 14.449 16.013 17.535 19.023 20.483 16.812 18.475 20.090 21.666 23.209 18.548 20.278 21.955 23.589 25.188 11 12 13 14 15 2.603 3.074 3.565 4.075 4.601 3.053 3.571 4.107 4.660 5.229 3.816 4.404 5.009 5.629 6.262 4.575 5.226 5.892 6.571 7.261 19.675 21.026 22.362 23.685 24.996 21.920 23.337 24.736 26.119 27.488 24.725 26.217 27.688 29.141 30.578 26.757 28.300 29.819 31.319 32.801 16 17 18 19 20 5.142 5.697 6.265 6.844 7.434 5.812 6.408 7.015 7.633 8.260 6.908 7.564 8.231 8.907 9.591 7.962 8.672 9.390 10.117 10.851 26.296 27.587 28.869 30.144 31.410 28.845 30.191 31.526 32.852 34.170 32.000 33.409 34.805 36.191 37.566 34.267 35.718 37.156 38.582 39.997 21 22 23 24 25 8.034 8.643 9.260 9.886 10.520 8.897 9.542 10.196 10,856 11.524 10.283 10.982 11.689 12.401 13.120 11.591 12.338 13.091 13.848 14.611 32.671 33.924 35.172 36.415 37.652 35.479 36.781 38.076 39.364 40.646 38.932 40.289 41.638 42.980 1.314 41.401 42.796 44.181 45.558 46.928 26 27 28 29 11,160 11.808 12.461 13.121 13.787 12.198 12.879 13.565 14.256 14.953 13.844 14.573 15.308 16.047 16.791 15.379 16.151 16.928 17.708 18.493 38.885 40.113 41.337 42.557 43.773 41.923 43.194 44.461 45.722 46.979 45.642 46.963 48.278 49.588 50.892 48.290 49.645 50.993 52.336 53.672 * Abridged from Table 8 of Biometrika Tables for Statisticians, Vol. 1, by permission of E. S. Pearson and the Biometrika Trustees. Table V* Critical Values of the t Distribution 0 V 0.10 0.05 0.025 0.01 0.005 1 2 3 4 5 3.078 1.886 1.638 1.533 1.476 6.314 2.920 2.353 2.132 2.015 12.706 4.303 3.182 2.776 2.571 31.821 6.965 4.541 3.747 3.365 63.657 9.925 5.841 4.604 4.032 6 7 8 9 10 1.440 1.415 1.397 1.383 1.372 1.943 1.895 1.860 1.833 1.812 2.447 2.365 2.306 2.262 2.228 3.143 2.998 2.896 2.821 2.764 3.707 3.499 3.355 3.250 3.169 11 12 13 14 15 1.363 1.356 1.350 1.345 1.341 1.796 1.782 1.771 1.761 1.753 2.201 2.179 2.160 2.145 2.131 2.718 2.681 2.650 2.624 2,602 3.106 3.055 3.012 2.977 2.947 16 17 18 19 20 1.337 1.333 1.330 1.328 1.325 1.746 1.740 1.734 1.729 1.725 2.120 2.110 2.101 2.093 2.086 2.583 2.567 2.552 2.539 2.528 2.921 2.898 2.878 2.861 2.845 21 22 23 24 25 1.323 1.321 1.319 1.318 1.316 1.721 1.717 1.714 1.711 1.708 2.080 2.074 2.069 2.064 2.060 2.518 2.508 2.500 2.492 2.485 2.831 2.819 2.807 2.797 2.787 26 27 28 29 inf. 1.315 1.314 1.313 1.311 1.282 1.706 1.703 1.701 1.699 1.645 2.056 2.052 2.048 2.045 1.960 2.479 2.473 2.467 2.462 2.326 2.779 2.771 2.763 2.756 2.576 From Table IV of R. A. Fisher, Statistical Methods for Research Workers, published by Oliver & Boyd Ltd., Edinburgh, by permission of the author and publishers


