Answered step by step
Verified Expert Solution
Question
1 Approved Answer
Advanced Worksheets (Use NorCalOccData.xlsx for the chart below) a. Create bar graph that shows the number of jobs by occupation (JobTitle) in northern California metro
- Advanced Worksheets (Use NorCalOccData.xlsx for the chart below)
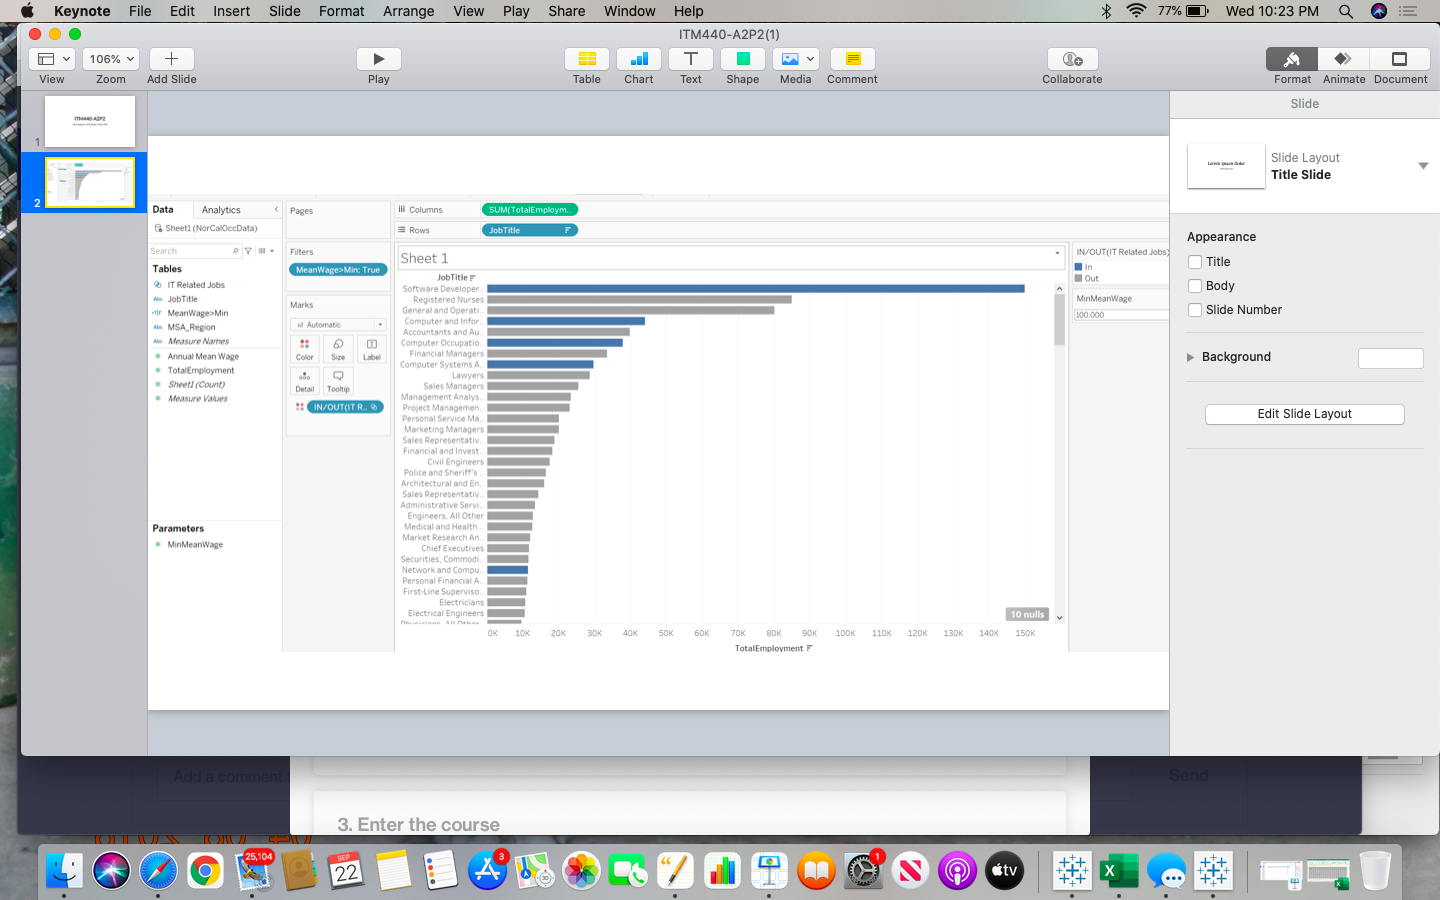
a. Create bar graph that shows the number of jobs by occupation (JobTitle) in northern California metro regions. Highlight IT related jobs (Create set for IT related job titles (see examples below) and use that to color the bars in the bar graph- Hint: see 14.1 Creating Sets).
b. Allow the use to input a parameter for the minimum mean wage and filter the jobs displayed to show only those that are greater than the minim wage.
This is how the chart has to look on Tableau I have the excel needed but cannot attach it here.

Step by Step Solution
There are 3 Steps involved in it
Step: 1

Get Instant Access to Expert-Tailored Solutions
See step-by-step solutions with expert insights and AI powered tools for academic success
Step: 2

Step: 3

Ace Your Homework with AI
Get the answers you need in no time with our AI-driven, step-by-step assistance
Get Started


