aejkhawejklyhalwjkehawjkleh helppp meeee read carefully thankss Below are four bivariate data sets and their scatter plots. (Note that all of the scatter plots are displayed
aejkhawejklyhalwjkehawjkleh helppp meeee
read carefully thankss
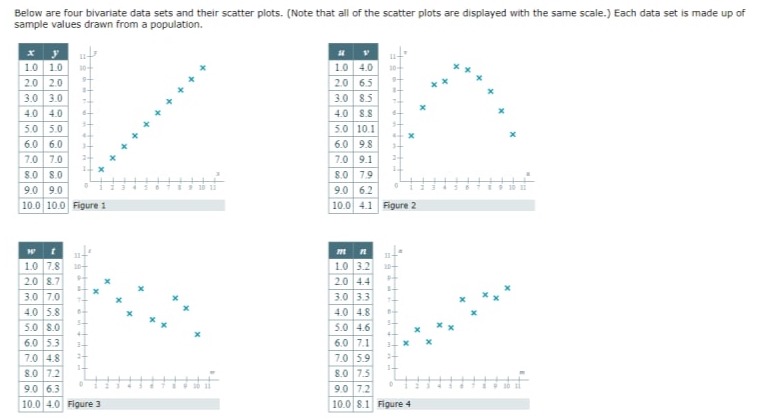
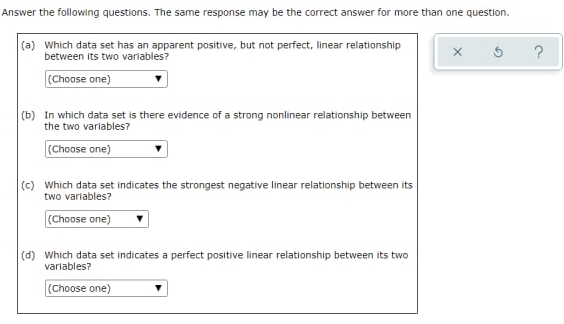
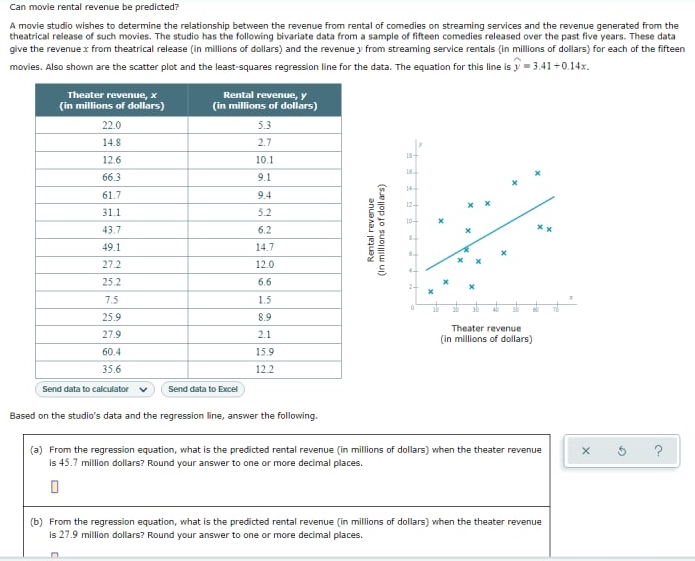
Below are four bivariate data sets and their scatter plots. (Note that all of the scatter plots are displayed with the same scale.) Each data set is made up of sample values drawn from a population. 10 1.0 10 4.0 20 2.0 20 65 3.0 3.0 3.0 85 40 4.0 40 5.0 5.0 5.0 10.1 60 6.0 6.0 98 7.0 7.0 7.0 9.1 80 79 90 9.0 10 Li 90 6.2 10.0 10.0 Figure 1 10.01 4.1 Figure 2 11- 10 78 10 3.2 20 87 20 44 3.0 170 3.0 33 40 5.8 40 4.8 5.0 8.0 5.0 4.6 6.0 53 60 7.1 70 14.8 7.0 5.9 8.0 17.2 8.0 7.5 90 63 90 7.2 10.0 4.0 Figure ] 10.0 8.1 Figure 4Answer the following questions. The same response may be the correct answer for more than one question. (a) Which data set has an apparent positive, but not perfect, linear relationship between its two variables? X 5 (Choose one) (b) In which data set is there evidence of a strong nonlinear relationship between the two variables? (Choose one) (c) Which data set indicates the strongest negative linear relationship between its two variables? (Choose one) (d) Which data set indicates a perfect positive linear relationship between its two variables? (Choose one)Can movie rental revenue be predicted? A movie studio wishes to determine the relationship between the revenue from rental of comedies on streaming services and the revenue generated from the theatrical release of such movies. The studio has the following bivariate data from a sample of fifteen comedies released over the past five years. These data give the revenue x from theatrical release (In millions of dollars) and the revenue y from streaming service rentals (In millions of dollars) for each of the fifteen movies. Also shown are the scatter plot and the least-squares regression line for the data. The equation for this line is y = 3.41 +0.14x. Theater revenue, x Rental revenue, y (in millions of dollars) (in millions of dollars) 22.0 5.3 14.8 2.7 12.6 10.1 66.3 9.1 61.7 9.4 31.1 5.2 43.7 6.2 (In millions of dollars) Rental revenue 49.1 14.7 27.2 12.0 25.2 6.6 7.5 1.5 25.9 8.9 27.9 2.1 Theater revenue (In millions of dollars) 60.4 15.9 35.6 12.2 Send data to calculator v Send data to Excel Based on the studio's data and the regression line, answer the following. (a) From the regression equation, what is the predicted rental revenue (in millions of dollars) when the theater revenue X 5 ? Is 45.7 million dollars? Round your answer to one or more decimal places. (b) From the regression equation, what is the predicted rental revenue (in millions of dollars) when the theater revenue Is 27.9 million dollars? Round your answer to one or more decimal places
Step by Step Solution
There are 3 Steps involved in it
Step: 1
Get Instant Access to Expert-Tailored Solutions
See step-by-step solutions with expert insights and AI powered tools for academic success
Step: 2
Step: 3
Ace Your Homework with AI
Get the answers you need in no time with our AI-driven, step-by-step assistance