Answered step by step
Verified Expert Solution
Question
1 Approved Answer
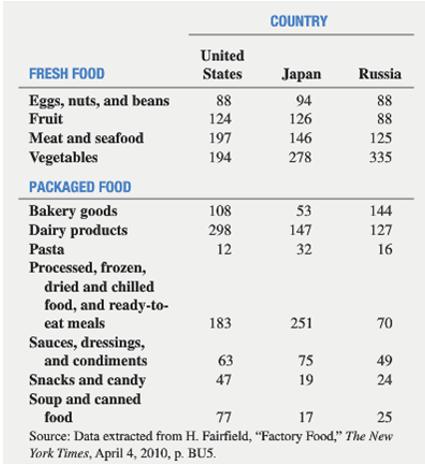
a. For the United States, Japan, and Russia construct bar charts for the different types of fresh foods consumed. b. For the United States, Japan,
a. For the United States, Japan, and Russia construct bar charts for the different types of fresh foods consumed.
b. For the United States, Japan, and Russia construct pie charts for the different types of packaged foods consumed.
c. What conclusions can you reach concerning differences between the United States, Japan, and Russia in the fresh foods and packaged foods consumed?

COUNTRY United FRESH FOOD States Japan Russia 88 Eggs, nuts, and beans Fruit 88 94 124 126 88 Meat and seafood 197 146 125 Vegetables 194 278 335 PACKAGED FOOD Bakery goods Dairy products Pasta 108 53 144 298 147 127 12 32 16 Processed, frozen, dried and chilled food, and ready-to- eat meals 183 251 70 Sauces, dressings, and condiments 63 75 49 Snacks and candy Soup and canned food 47 19 24 77 17 25 Source: Data extracted from H. Fairfield, "Factory Food," The New York Times, April 4, 2010, p. BUS.
Step by Step Solution
★★★★★
3.46 Rating (156 Votes )
There are 3 Steps involved in it
Step: 1
a b c For Fresh foods 1 Russians are the largest consumer of vegetables 2 USA is the larg...
Get Instant Access to Expert-Tailored Solutions
See step-by-step solutions with expert insights and AI powered tools for academic success
Step: 2

Step: 3

Ace Your Homework with AI
Get the answers you need in no time with our AI-driven, step-by-step assistance
Get Started


