

Question
After completing Exhibit A and delivering the results to her supervisor, Derek Plaattje, Ms. Luhabe received the following email message from him: Thuli: Great job
After completing Exhibit A and delivering the results to her supervisor, Derek Plaattje, Ms. Luhabe received the following email message from him:
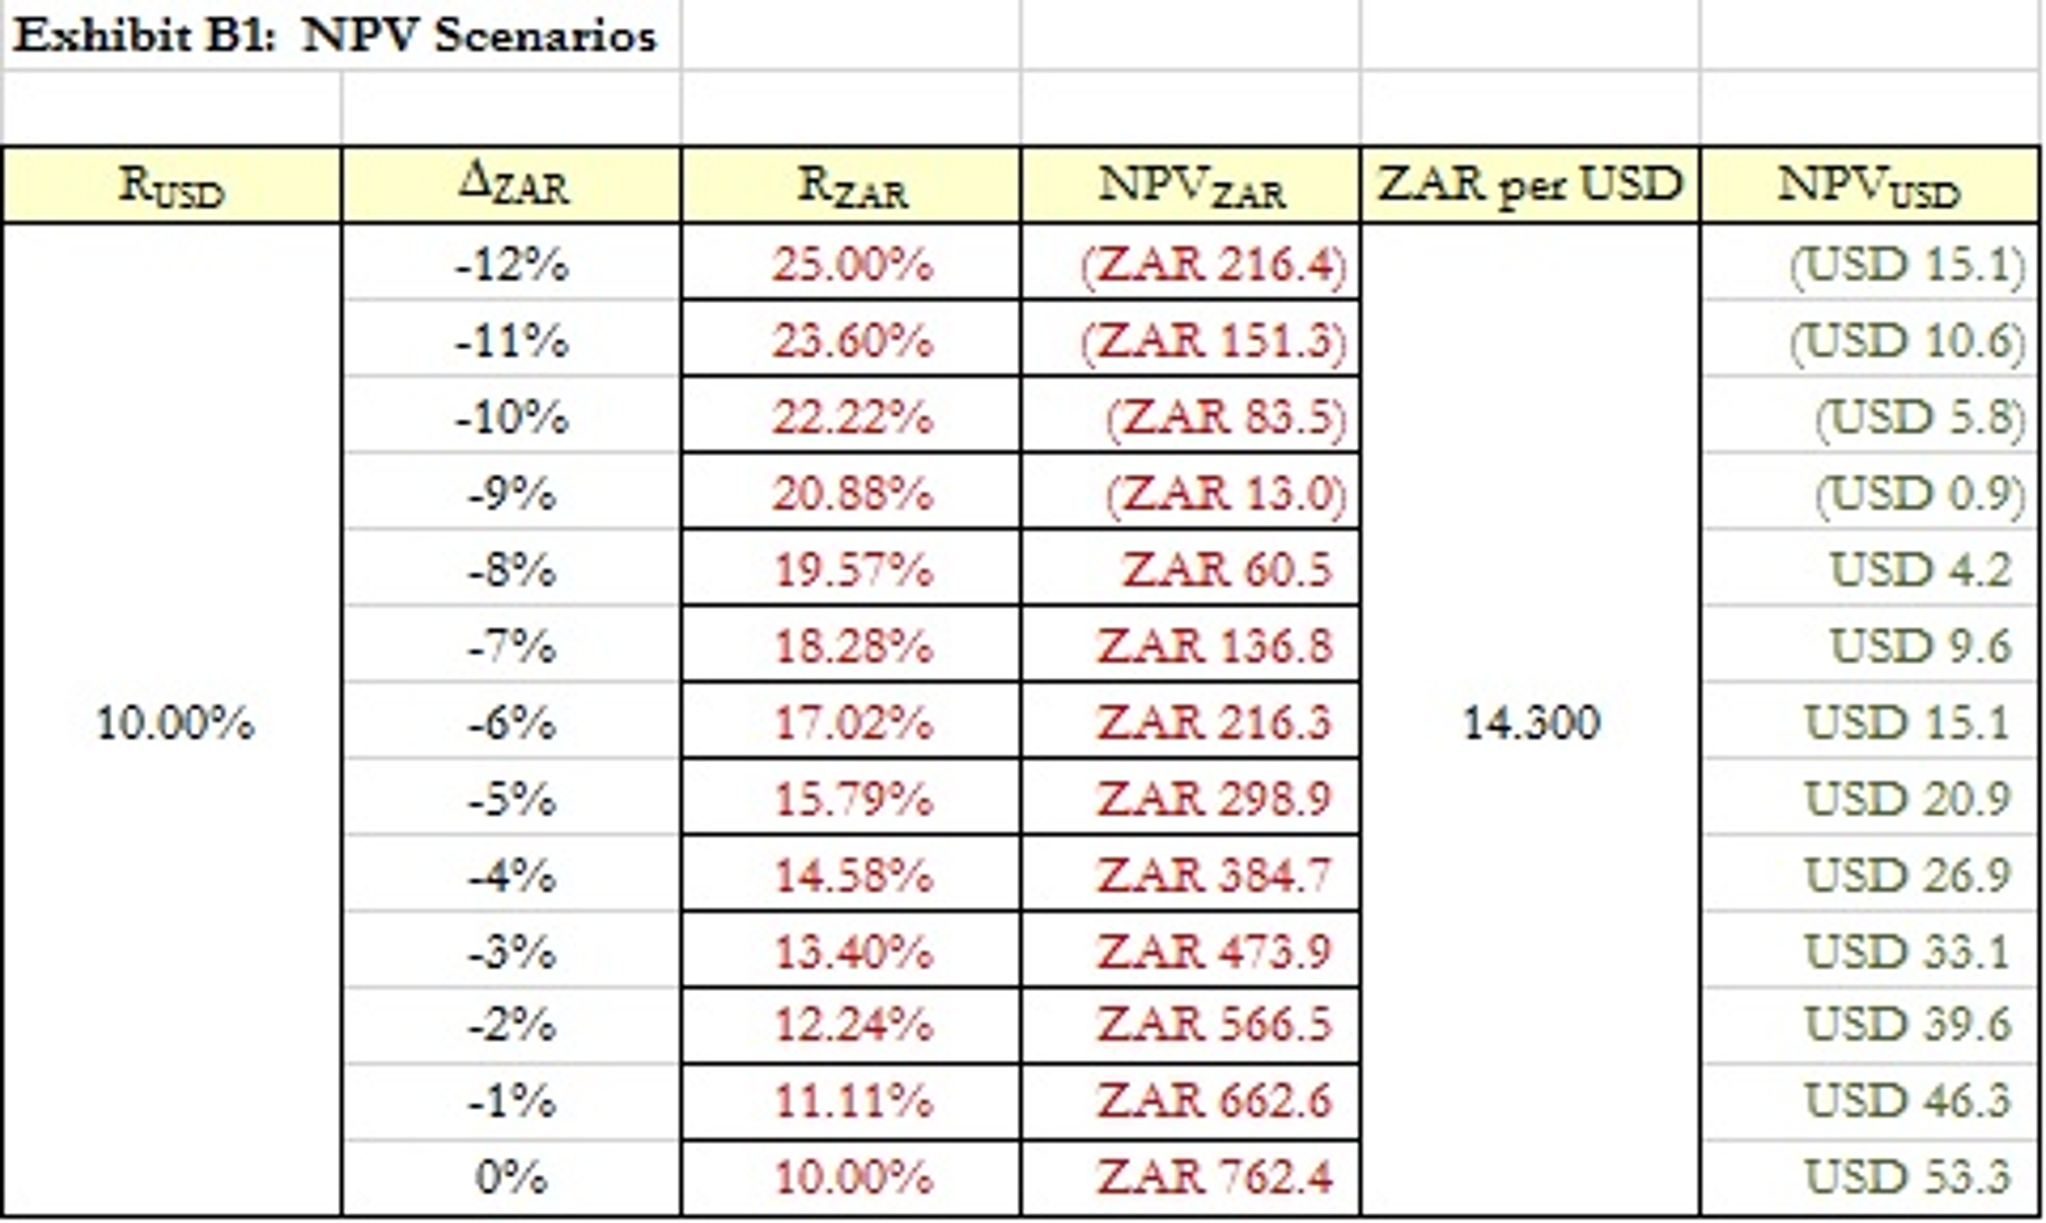
Thuli: Great job on the NPV analysis. However, our analysts on the ground in South Africa are accustomed to looking at projects from a South African perspective, especially when dealing with local financiers and contractors. Please extend the analysis by using the original ZAR cash flows as supplied, using an appropriate ZAR discount rate for a base case of 6.5% annual depreciation of the ZAR versus the USD, and showing the NPV in ZAR and USD terms. Id also like to see how sensitive the ZAR discount rate, ZAR NPV, and USD-equivalent NPV would be to alternative rates of currency movements, say for rates of ZAR change ranging from -12% to 0% by increments of 1%. Can you deliver that to me this afternoon? -DP
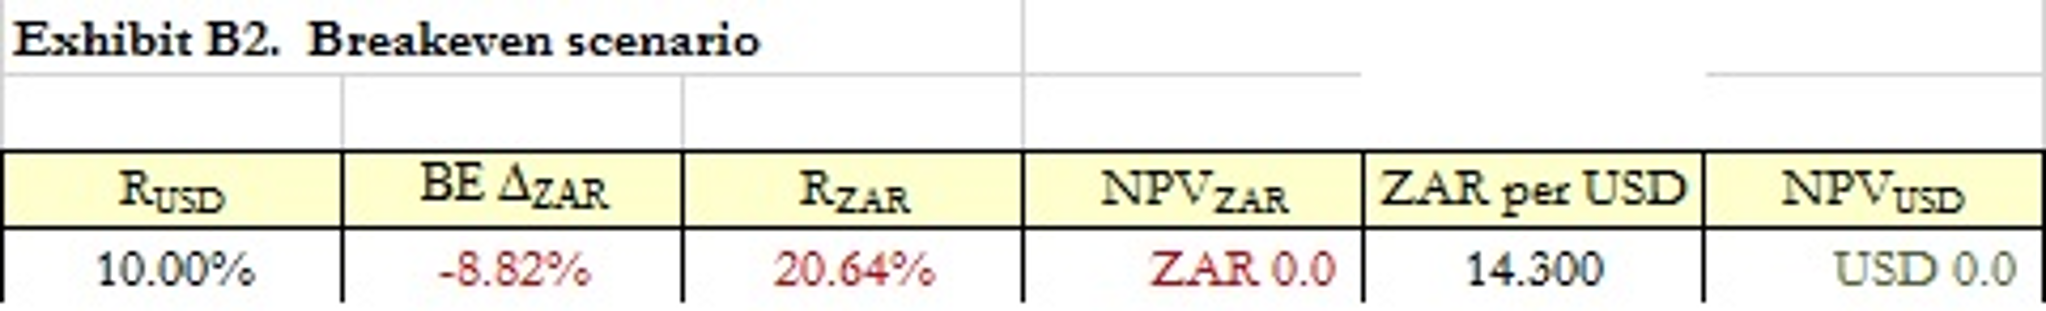
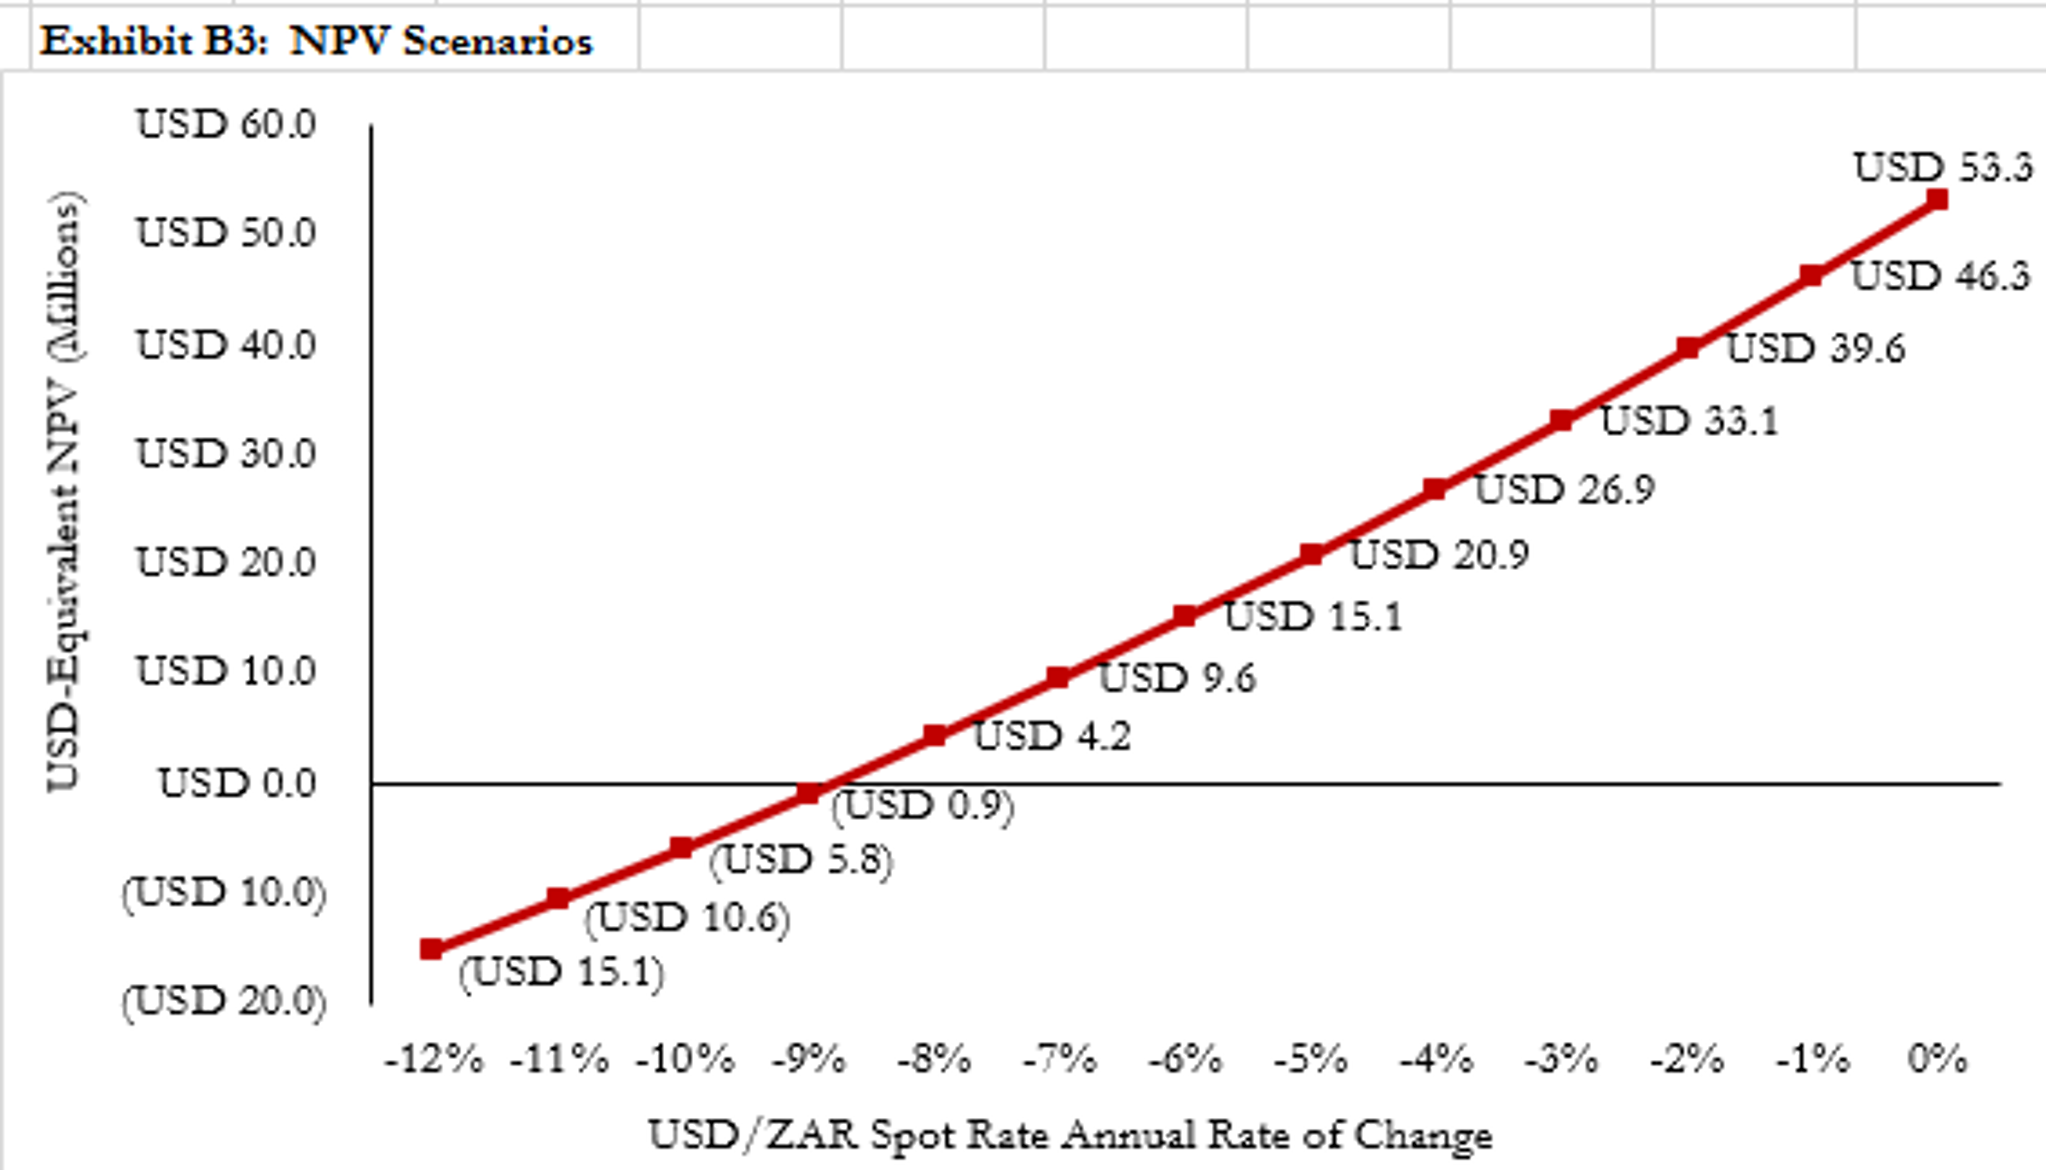
B. Complete Exhibit B1 showing the NPV in USD terms as a function of the exchange rate scenario. Identify the breakeven annual rate of currency movement over the next five years to the hundredth of a percentage point in Exhibit B2. Create a line graph as Exhibit B3 displaying the USD-equivalent NPV as a function of the exchange rate movement in a graph with the annual rate of change in the ZAR exchange rate on the horizontal axis (ranging from -12% to +0%) and the USD-equivalent NPV on an appropriately formatted vertical axis.
After delivering revised Exhibits A and B1-B3 to Derek Plaattje -- along with an appendix discussing exchange rate risk, Ms. Luhabe received the following email message from him:
Thuli: Great job. You've given me a lot to work with as I discuss this project with top management. One more tweak, if you don't mind: The project's year 5 terminal value is critical to this analysis. We've assumed a year 6 operational cash flow of ZAR 265 million and a cap rate of 10.5% to arrive at that terminal value in year 5. Cap rates -- operating income divided by asset value -- are used by investors to value income producing assets like our resort, and they vary across countries depending on market conditions, investment climate, and political risk. If South Africa's investment climate and political risk were to improve or deteriorate over the next five years that might have a big effect on the terminal value and the project's NPV. So, please prepare an exhibit-- table or graph, whatever you deem best -- showing the sensitivity of the project's ZAR terminal value and USD NPV to the cap rate used to arrive at the terminal value in year 5. Assume a range of cap rates ranging from 8% to 13% with intervals of 0.5%. Assume the base case ZAR operational cash flows and the rate of currency change of 6.5% depreciation per year you used in your exhibit A. I promise this is my last request for today! -DP
D. Prepare an Exhibit D satisfying Mr. Plaatje's request.
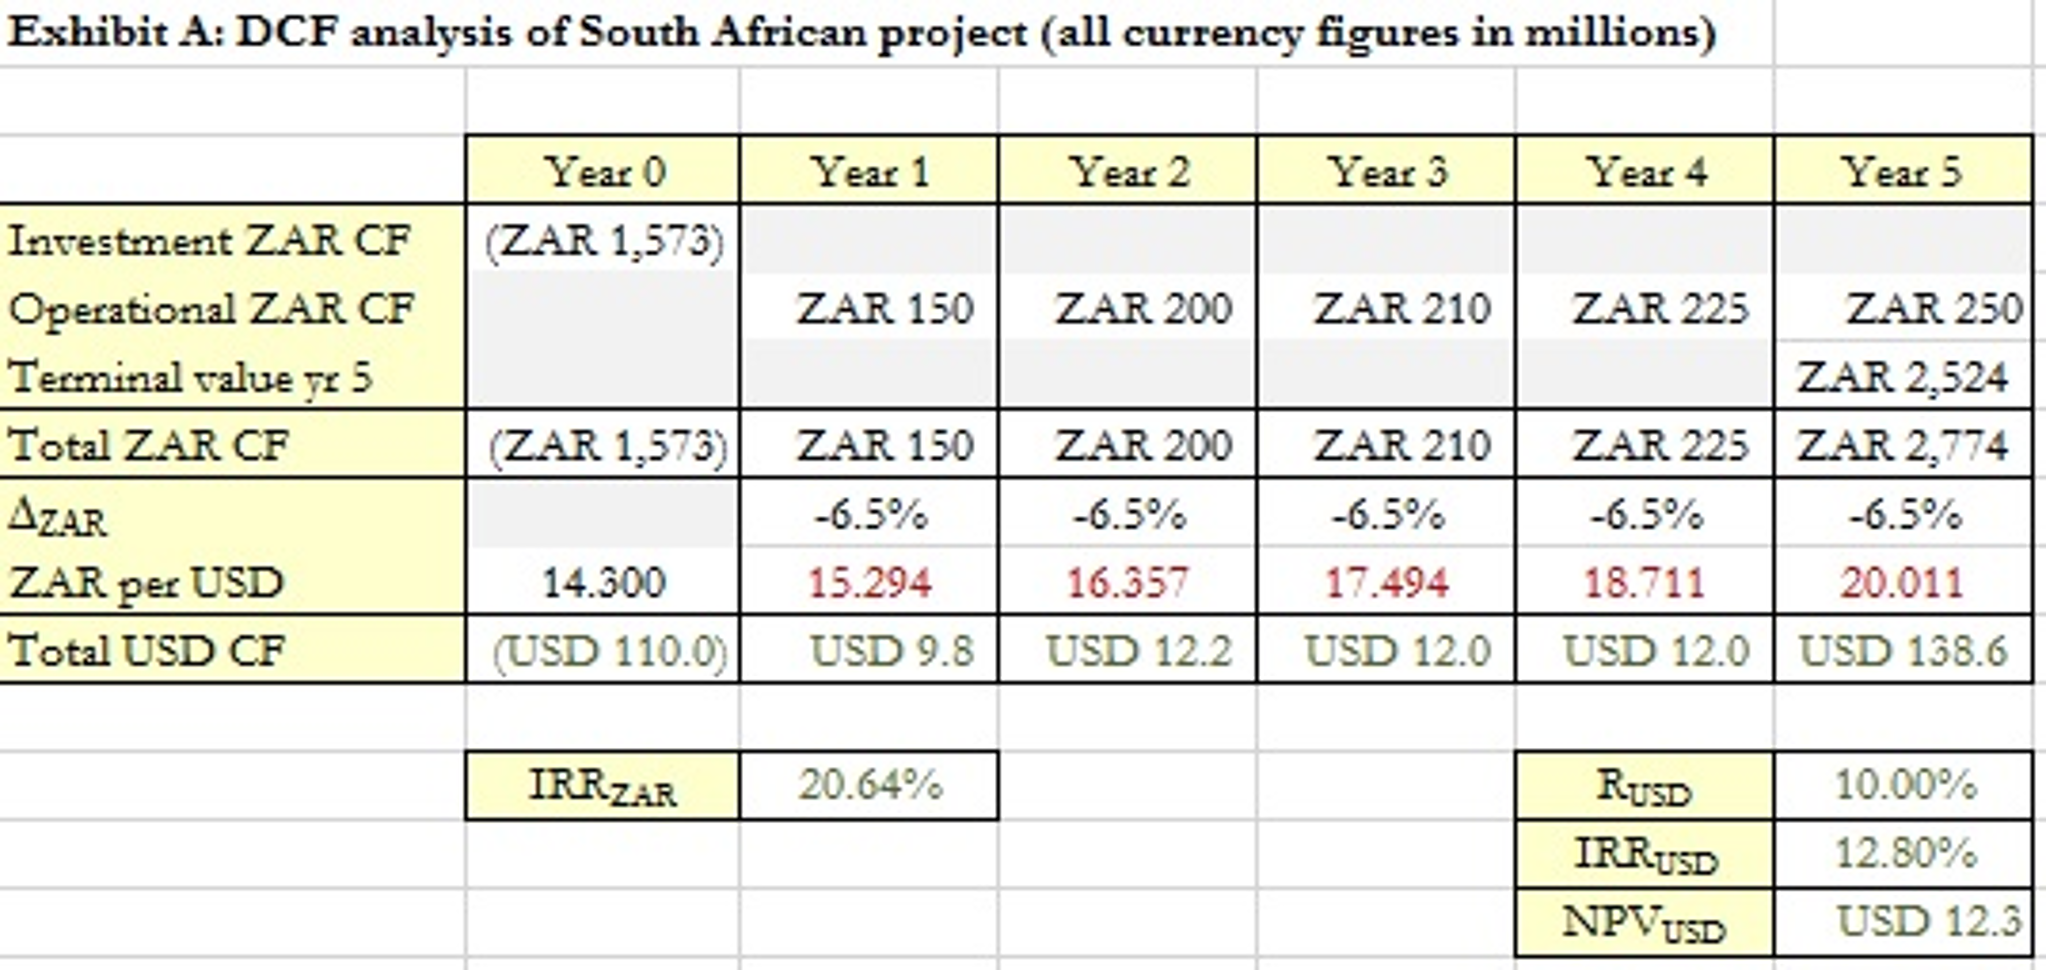
Exhibit A: DCF analysis of South African project (all currency figures in millions) Year 0 Year 1 Year 2 Yeat Year 4 Year S Investment ZAR CF (ZAR 1,575) Operational ZAR CF l ermminal value vr 3 Total ZAR CF AZAR ZAR per USD Total USD CF ZAR 150 ZAR 200 ZAR 210ZAR 225ZAR 250 ZAR 2.524 (ZAR 1,573)ZAR 150ZAR 200 ZAR 210ZAR 225|ZAR 2,77-4 -6.5% -65% -6.5% -65% -65% 15.294 USD 9.8 | USD 12.2 | USD 12.0 | USD 12.0 | USD 138.6 14.300 6.357 17.494 18.711 20.011 USD 110.01 IRRZAR 10.00% 12.80% USD 12.3 20.64% USD IRR USD NPVUSDStep by Step Solution
There are 3 Steps involved in it
Step: 1

Get Instant Access to Expert-Tailored Solutions
See step-by-step solutions with expert insights and AI powered tools for academic success
Step: 2

Step: 3
Ace Your Homework with AI
Get the answers you need in no time with our AI-driven, step-by-step assistance
Get Started
Advanced Finance Theories
Authors: Ser-Huang Poon
1st Edition
9814460370, 978-9814460378