

Answered step by step
Verified Expert Solution
Question
1 Approved Answer
After completing the risk return profile for 60 stocks, a efficient frontier was plotted which can be seen below. How do I decribe results of
After completing the risk return profile for 60 stocks, a efficient frontier was plotted which can be seen below. How do I decribe results of my data linking it back to CAPM, what the results mean? Why its shaped that way in 300 words or less. 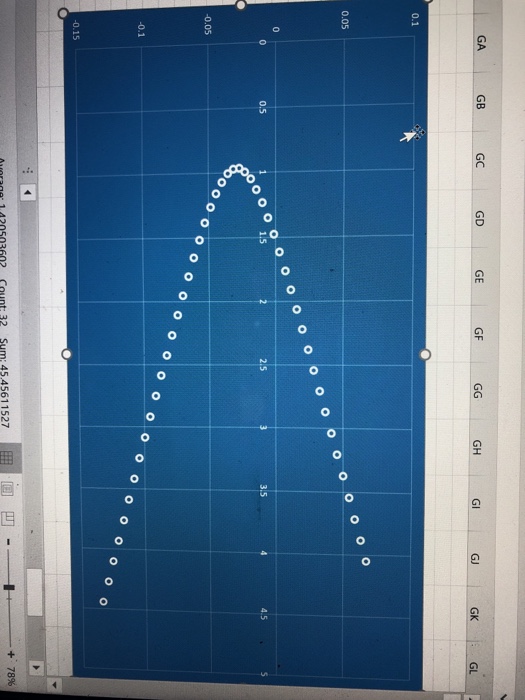
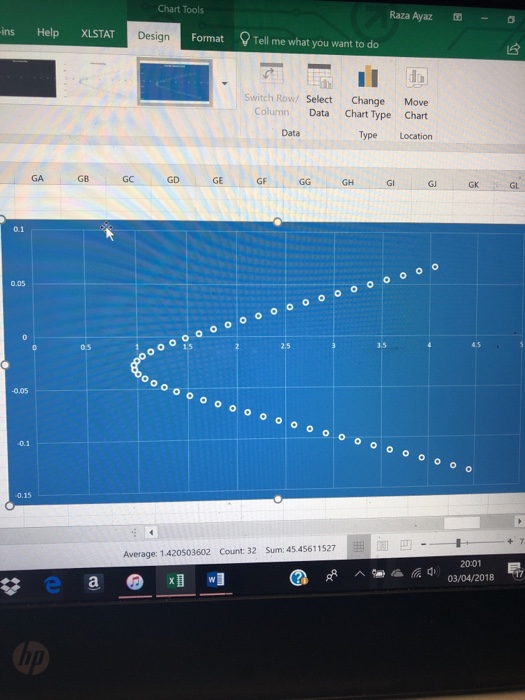
GA GB GC GD GE GF GH GI GJ GK GL 0.1 0.05 0.5 o 15 2.5 3.5 4.5 0.05 -0.1 0.15 Sum: 45.4561 1527 ?|? ? ! + 78% Average, 1420503602 Count 32 Step by Step Solution
There are 3 Steps involved in it
Step: 1

Get Instant Access to Expert-Tailored Solutions
See step-by-step solutions with expert insights and AI powered tools for academic success
Step: 2

Step: 3
Ace Your Homework with AI
Get the answers you need in no time with our AI-driven, step-by-step assistance
Get Started
Finance Capital A Study In The Latest Phase Of Capitalist Development
Authors: Rudolph Hilferding
1st Edition
0415436648, 978-0415436649