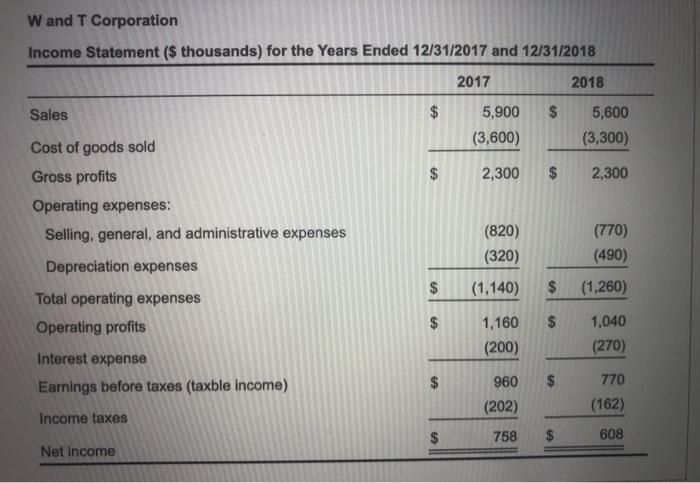
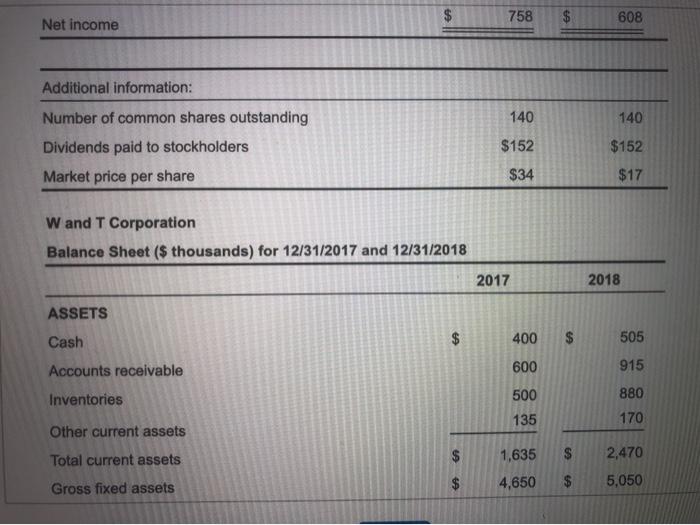
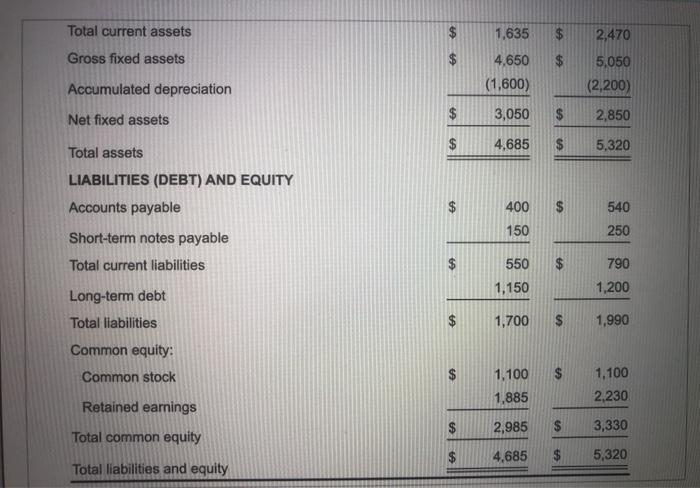
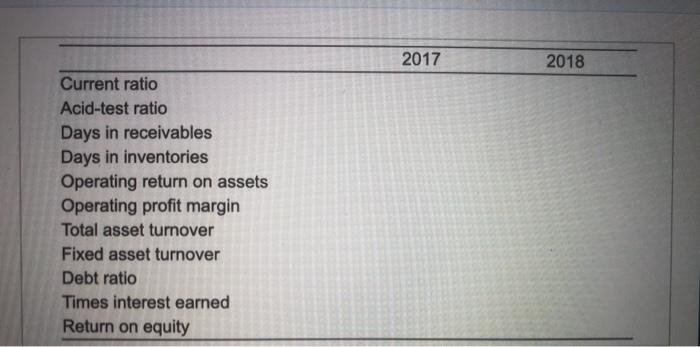
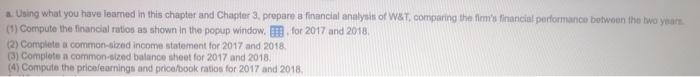
After graduating from college in May 2018, Ryan Crews started his career in finance at the W&T Corporation, a small to medium-sized warehouse distributor in Nashville, Tennessee. The company was founded by David Winston and Colin Tabor in 2005, after they have worked together in management at Walmart. Although Crews had an offer from Sam's Club, he became excited about the opportunity with W&T For W&T, 2017 tumed out to be a good financial year. But in 2018, the company experienced a 5.2 percent sales reduction, where sales declined from $5.9 million to $5.6 million. The downturn then led to other financial problems, including a 50 percent reduction in the company's stock price. The share price went from $34 per share at the end of 2017 to $17 per share at the end of 20181 David Winston and Colin Tabor want to understand what may have happened Financial information for W&T for both years is shown in the popup window, where all the numbers, except for per-share data, are shown in thousands W and T Corporation Income Statement ($ thousands) for the Years Ended 12/31/2017 and 12/31/2018 2017 2018 Sales $ $ 5,900 (3,600) 5,600 (3,300) $ 2,300 $ 2,300 Cost of goods sold Gross profits Operating expenses: Selling, general, and administrative expenses Depreciation expenses Total operating expenses Operating profits (820) (320) (770) (490) $ $ (1,140) $ (1,260) $ $ $ 1,160 (200) 1,040 (270) $ 960 $ Interest expense Earnings before taxes (taxble income) Income taxes 770 (202) (162) $ 758 $ 608 Net Income Total current assets $ 1,635 2,470 Gross fixed assets 4,650 (1,600) 5,050 (2,200) Accumulated depreciation Net fixed assets $ 3,050 $ 2,850 $ 4,685 $ 5,320 Total assets LIABILITIES (DEBT) AND EQUITY Accounts payable $ 400 150 540 250 Short-term notes payable Total current liabilities $ $ 790 550 1,150 1,200 Long-term debt Total liabilities 1,700 $ 1,990 Common equity: Common stock $ CA 1,100 1,885 1,100 2.230 Retained earnings $ $ 2,985 3,330 Total common equity $ 4,685 $ 5,320 Total liabilities and equity 2017 2018 Current ratio Acid-test ratio Days in receivables Days in inventories Operating return on assets Operating profit margin Total asset turnover Fixed asset turnover Debt ratio Times interest earned Return on equity Using what you have learned in this chapter and Chapter 3 prepare a financial analysis of W&T comparing the firm's financial performance betwon the two years (1) Compute the financial ratios as shown in the popup window. I for 2017 and 2018 (2) Complete a common-sized income statement for 2017 and 2018 (3) Complete a common-sized balance sheet for 2017 and 2018, (4) Compute the pricelearnings and pricebook ratios for 2017 and 2018