Answered step by step
Verified Expert Solution
Question
1 Approved Answer
After viewing the video tutorial about calculating a Markov Analysis, complete the following analysis by performing the necessary calculations and typing in your answers. The
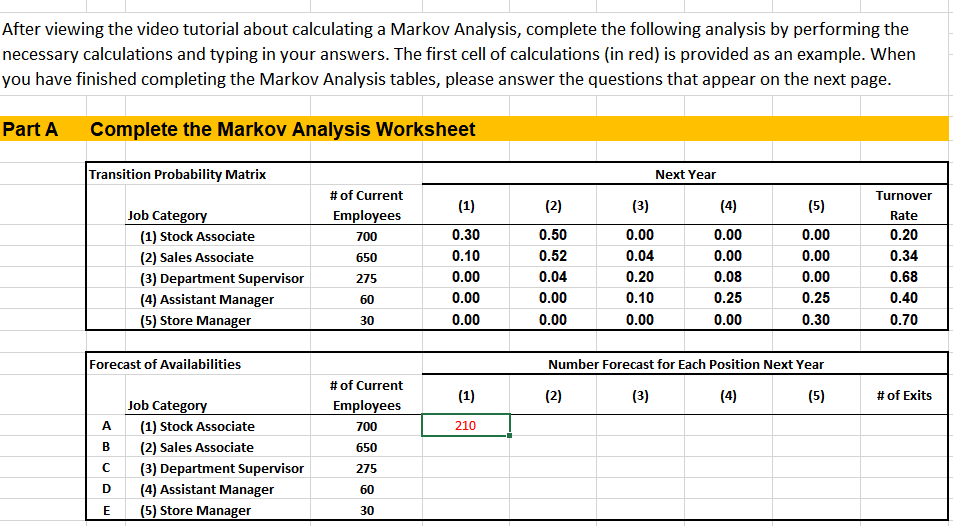
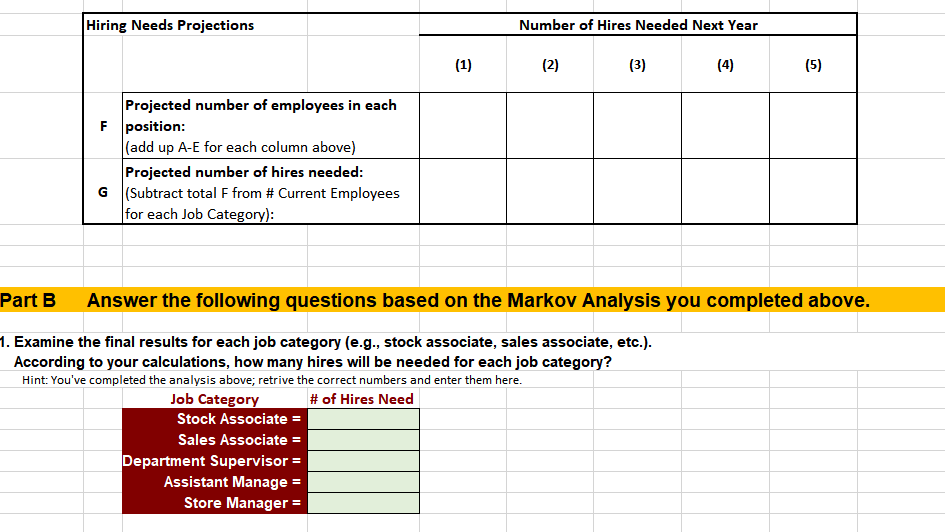
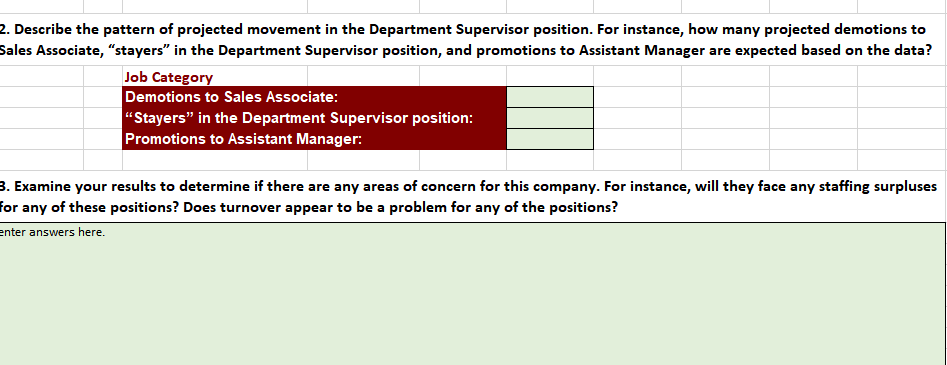
After viewing the video tutorial about calculating a Markov Analysis, complete the following analysis by performing the necessary calculations and typing in your answers. The first cell of calculations (in red) is provided as an example. When you have finished completing the Markov Analysis tables, please answer the questions that appear on the next page. Part A Complete the Markov Analysis Worksheet Transition Probability Matrix Next Year # of Current Employees 700 (1) (3) (4) Job Category (1) Stock Associate (2) Sales Associate (3) Department Supervisor (4) Assistant Manager (5) Store Manager 650 275 60 30 0.30 0.10 0.00 0.00 0.00 (2) 0.50 0.52 0.04 0.00 0.00 0.00 0.04 0.20 0.10 0.00 0.00 0.00 0.08 0.25 0.00 (5) 0.00 0.00 0.00 0.25 0.30 Turnover Rate 0.20 0.34 0.68 0.40 0.70 Forecast of Availabilities Number Forecast for Each Position Next Year (1) (2) (3) (4) (5) #of Exits # of Current Employees 700 650 A 210 B Job Category (1) Stock Associate (2) Sales Associate (3) Department Supervisor (4) Assistant Manager (5) Store Manager 275 D 60 E 30 Hiring Needs Projections Number of Hires Needed Next Year (1) (2) (3) (4) (5) Projected number of employees in each F position: (add up A-E for each column above) Projected number of hires needed: G (Subtract total F from # Current Employees for each Job Category): Part B Answer the following questions based on the Markov Analysis you completed above. 1. Examine the final results for each job category (e.g., stock associate, sales associate, etc.). According to your calculations, how many hires will be needed for each job category? Hint: You've completed the analysis above; retrive the correct numbers and enter them here. Job Category # of Hires Need Stock Associate = Sales Associate Department Supervisor = Assistant Manage Store Manager 2. Describe the pattern of projected movement in the Department Supervisor position. For instance, how many projected demotions to Sales Associate, "stayers in the Department Supervisor position, and promotions to Assistant Manager are expected based on the data? Job Category Demotions to Sales Associate: Stayers in the Department Supervisor position: Promotions to Assistant Manager: B. Examine your results to determine if there are any areas of concern for this company. For instance, will they face any staffing surpluses for any of these positions? Does turnover appear to be a problem for any of the positions? enter answers here. After viewing the video tutorial about calculating a Markov Analysis, complete the following analysis by performing the necessary calculations and typing in your answers. The first cell of calculations (in red) is provided as an example. When you have finished completing the Markov Analysis tables, please answer the questions that appear on the next page. Part A Complete the Markov Analysis Worksheet Transition Probability Matrix Next Year # of Current Employees 700 (1) (3) (4) Job Category (1) Stock Associate (2) Sales Associate (3) Department Supervisor (4) Assistant Manager (5) Store Manager 650 275 60 30 0.30 0.10 0.00 0.00 0.00 (2) 0.50 0.52 0.04 0.00 0.00 0.00 0.04 0.20 0.10 0.00 0.00 0.00 0.08 0.25 0.00 (5) 0.00 0.00 0.00 0.25 0.30 Turnover Rate 0.20 0.34 0.68 0.40 0.70 Forecast of Availabilities Number Forecast for Each Position Next Year (1) (2) (3) (4) (5) #of Exits # of Current Employees 700 650 A 210 B Job Category (1) Stock Associate (2) Sales Associate (3) Department Supervisor (4) Assistant Manager (5) Store Manager 275 D 60 E 30 Hiring Needs Projections Number of Hires Needed Next Year (1) (2) (3) (4) (5) Projected number of employees in each F position: (add up A-E for each column above) Projected number of hires needed: G (Subtract total F from # Current Employees for each Job Category): Part B Answer the following questions based on the Markov Analysis you completed above. 1. Examine the final results for each job category (e.g., stock associate, sales associate, etc.). According to your calculations, how many hires will be needed for each job category? Hint: You've completed the analysis above; retrive the correct numbers and enter them here. Job Category # of Hires Need Stock Associate = Sales Associate Department Supervisor = Assistant Manage Store Manager 2. Describe the pattern of projected movement in the Department Supervisor position. For instance, how many projected demotions to Sales Associate, "stayers in the Department Supervisor position, and promotions to Assistant Manager are expected based on the data? Job Category Demotions to Sales Associate: Stayers in the Department Supervisor position: Promotions to Assistant Manager: B. Examine your results to determine if there are any areas of concern for this company. For instance, will they face any staffing surpluses for any of these positions? Does turnover appear to be a problem for any of the positions? enter answers here
Step by Step Solution
There are 3 Steps involved in it
Step: 1

Get Instant Access to Expert-Tailored Solutions
See step-by-step solutions with expert insights and AI powered tools for academic success
Step: 2

Step: 3
Ace Your Homework with AI
Get the answers you need in no time with our AI-driven, step-by-step assistance
Get Started