Answered step by step
Verified Expert Solution
Link Copied!

Question

1 Approved Answer

a]Go to the Australian Bureau of Statistics website and find the latest (December 2019) figures for output. In particular, find the percentage change in Trend

a]Go to the Australian Bureau of Statistics website and find the latest (December 2019) figures for output. In particular, find the percentage change in Trend GDP from the September Quarter 2019 to December Quarter 2019; and the December Quarter 2018 to December Quarter 2019; and the percentage change in Seasonally Adjusted GDP over the same two periods. (2 marks)

b) Do the same for the December 2018 figures.

c]Explain whether, based on the GDP data and all else equal, you would prefer to be incumbent Government running for re-election this time last year or now.

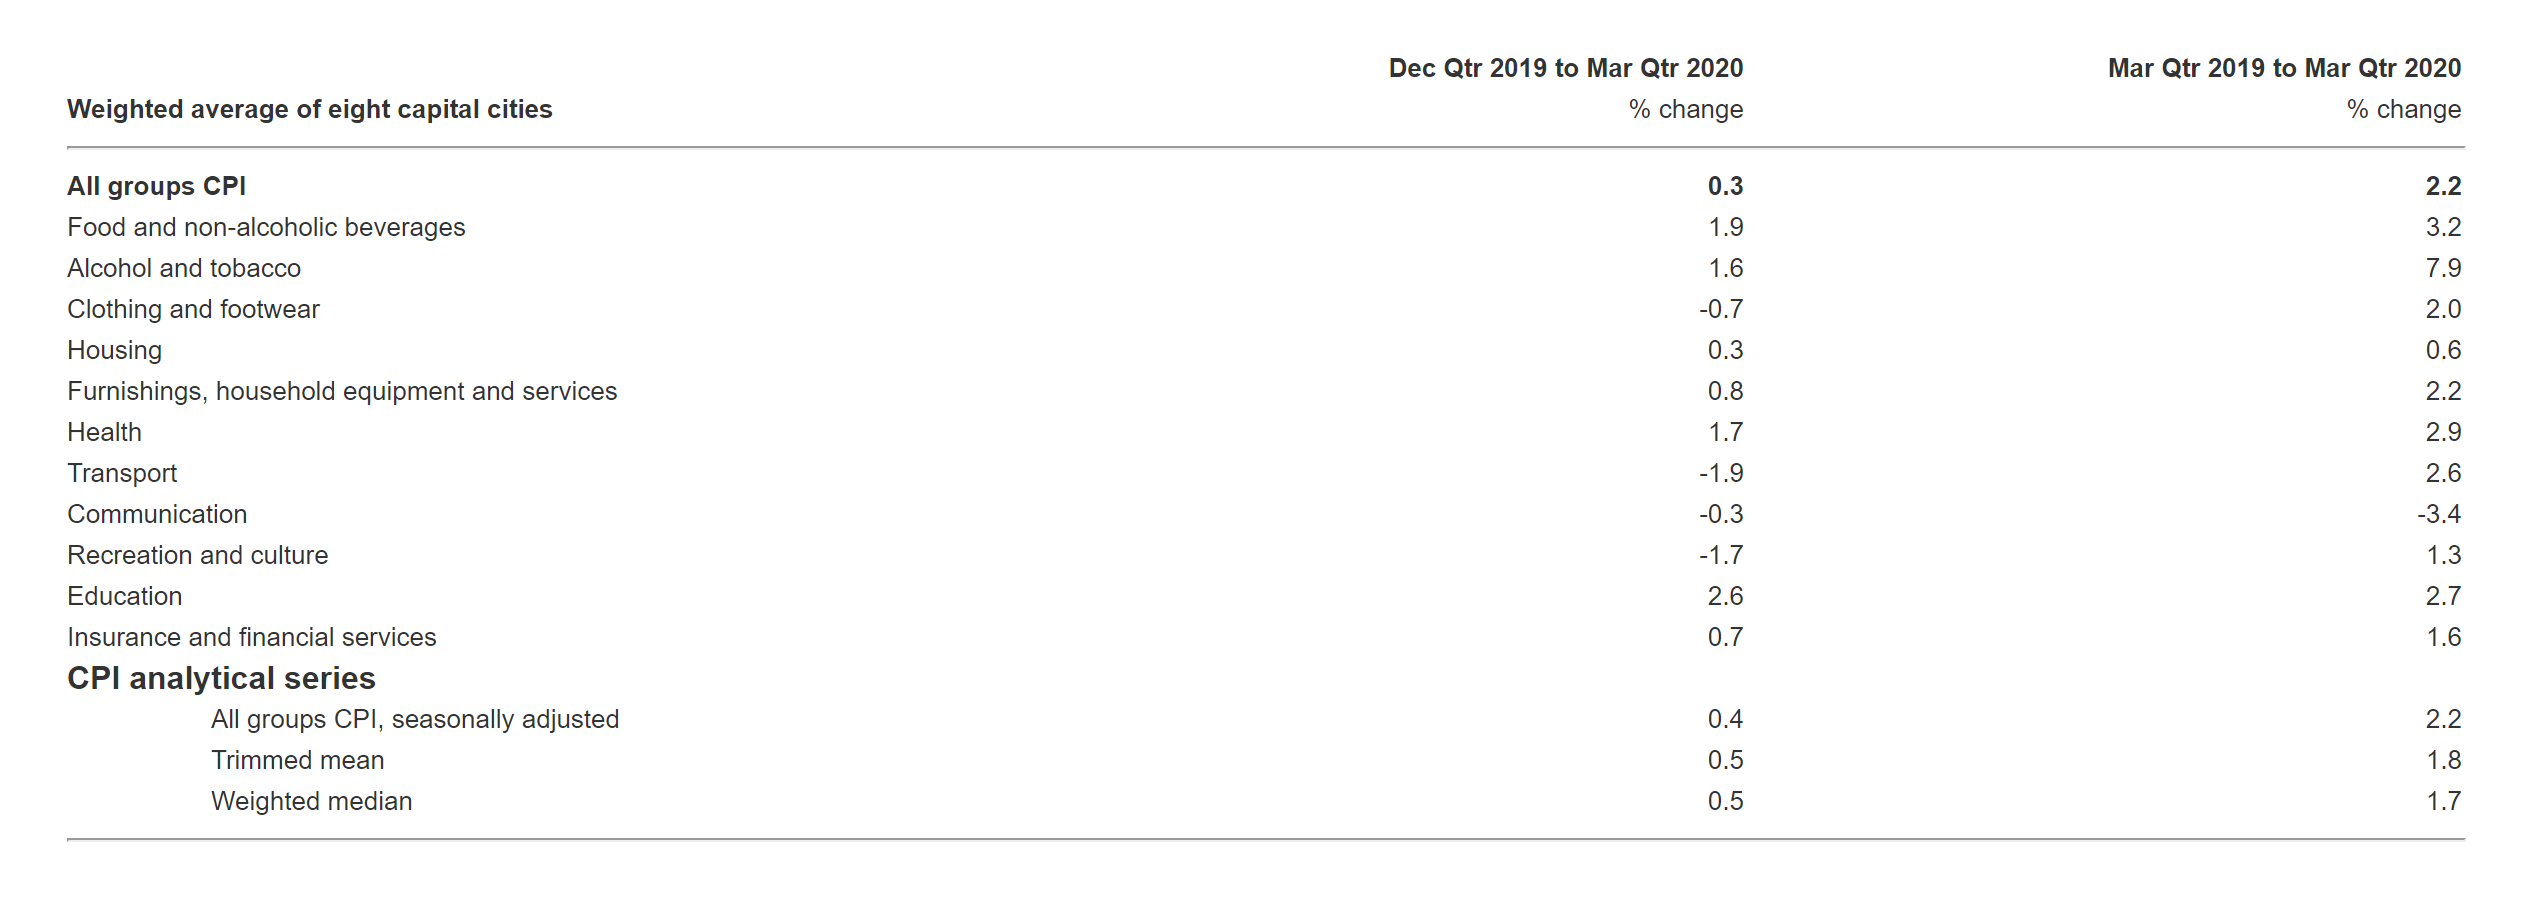
d?) Now find the ABS data for the Consumer Price Index, specifically report the figures for the December 2019 and December 2018 All Groups CPI and the Seasonally Adjusted CPI.

e? What are the categories that experienced the most significant price rises and falls? Discuss whether, given your usual consumption bundle, you were likely better or worse off in December 2019 compared to September 2019.

f} With COVID-19, there are talks about countries entering a period of recession. The article defines a technical recession as being two consecutive quarters of negative real GDP growth. What is the NBER (National Bureau of Economic Research) definition of a recession? (1 mark)

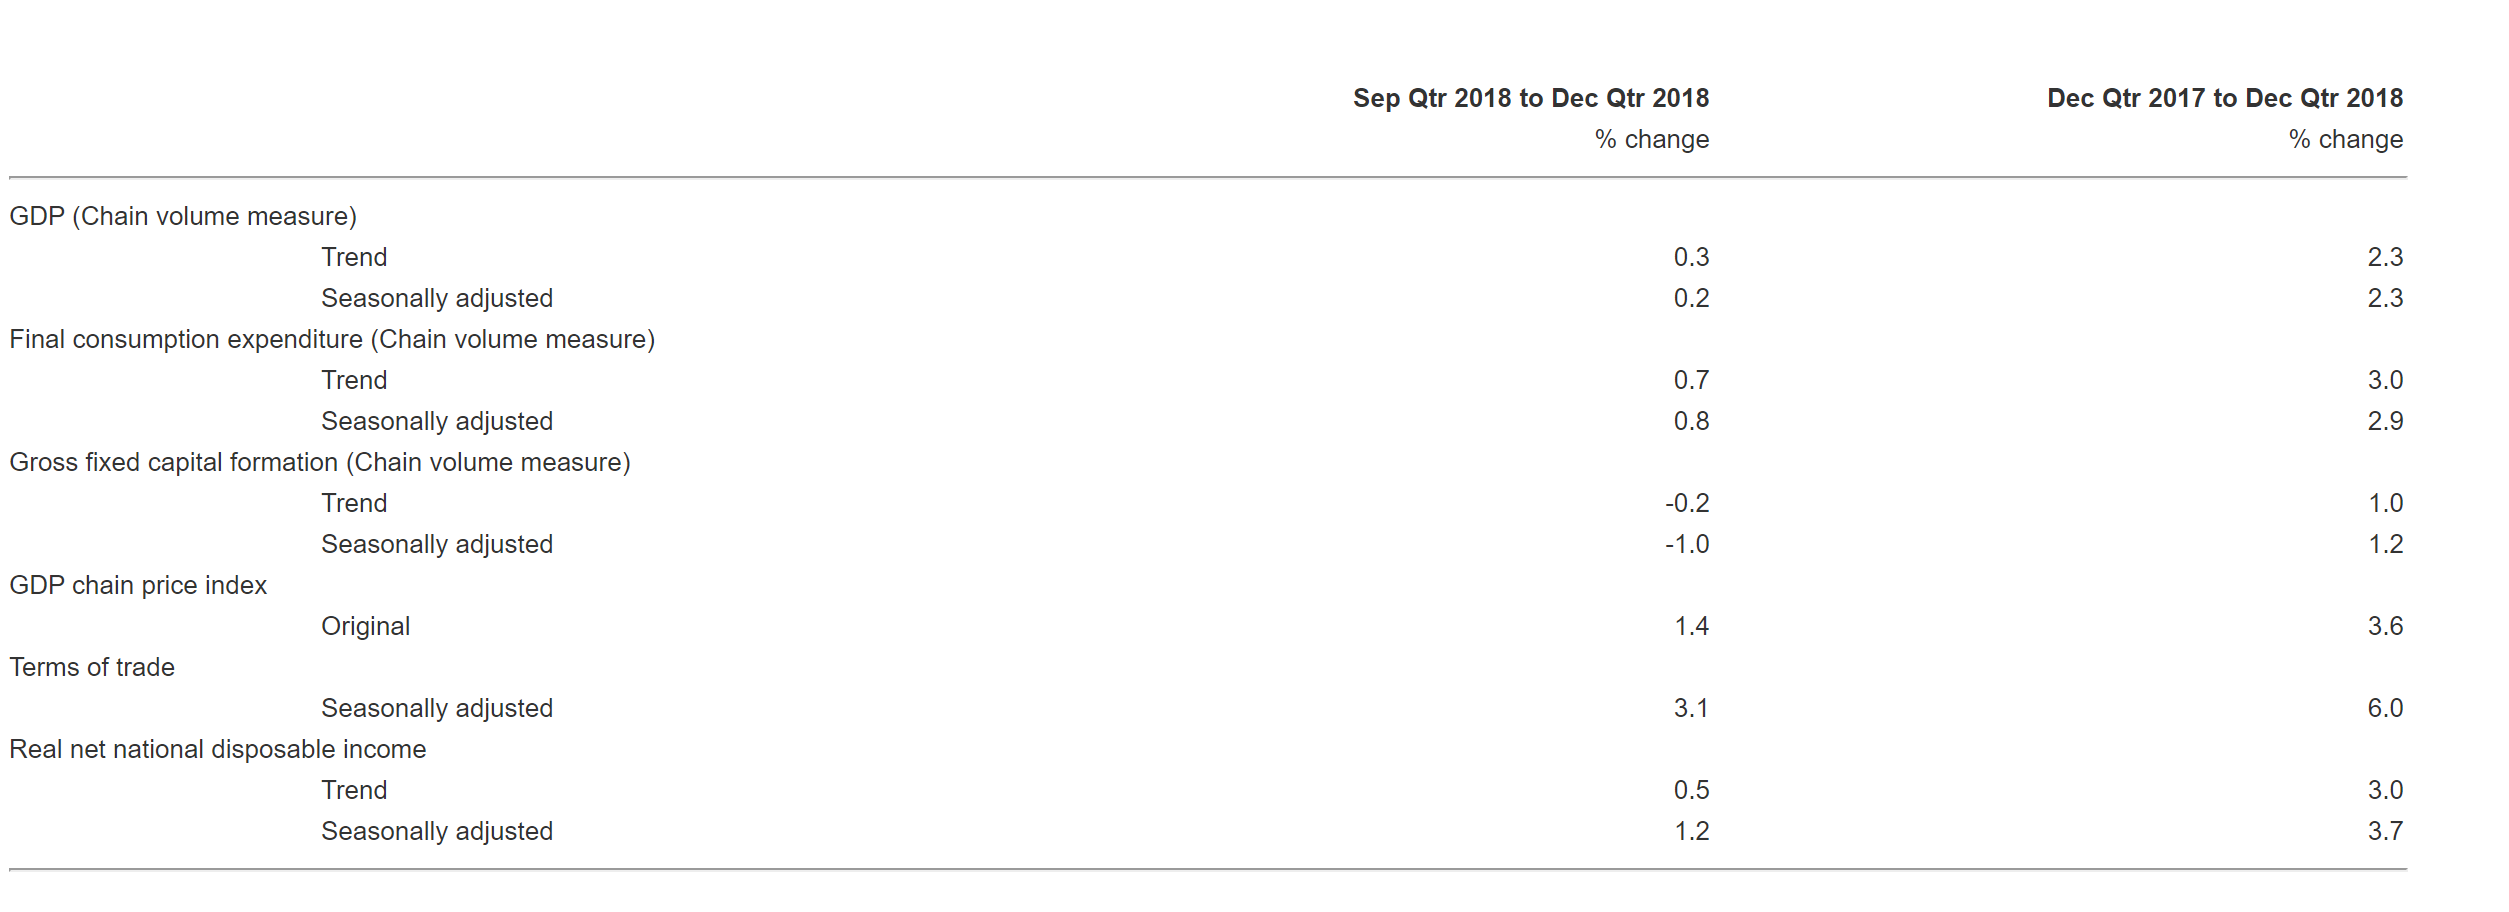
image text in transcribedimage text in transcribedimage text in transcribed
Seasonally adjusted, percentage change (a) Sep 18 to Dec 18 to Mar 19 to Jun 19 to Dec 18 Sep 19 to Mar 19 Dec 18 to Jun 19 Sep 19 Dec 19 Dec 19 Chain volume GDP and related measures (b) GDP GDP per capita (c) 0.2 0.5 0.6 0.6 0.5 0.1 2.2 Gross value added market sector (d) -0.2 0.2 0.2 -0.1 0.2 Real net national disposable income 0.6 0.5 0.7 0.3 1.0 0.4 1.2 1.8 Productivity 1.6 0.9 0.9 2.7 GDP per hour worked Real unit labour costs -0.4 -0.3 0.5 0.2 0.4 Prices -0.7 0.2 0.1 1.3 0.9 GDP chain price index (original) Terms of trade 1.2 1.2 1.1 0.7 -1.2 Current price measures 2.6 3.2 1.8 1.5 0.2 5.3 -0.6 GDP Household saving ratio 1.2 1.6 1.5 1.2 3.0 0.3 3.5 4.1 2.6 4.8 3.6 naSep Qtr 2018 to Dec Qtr 2018 Dec Qtr 2017 to Dec Qtr 2018 % change % change GDP (Chain volume measure) Trend 0.3 2.3 Seasonally adjusted 0.2 2.3 Final consumption expenditure (Chain volume measure) Trend 0.7 3.0 Seasonally adjusted 0.8 2.9 Gross fixed capital formation (Chain volume measure) Trend 0.2 1.0 Seasonally adjusted -1.0 1.2 GDP chain price index Original 1.4 3.6 Terms of trade Seasonally adjusted 3.1 6.0 Real net national disposable income Trend 0.5 3.0 Seasonally adjusted 1.2 3.7Dec Qtr 2019 to Mar Qtr 2020 Mar Qtr 2019 to Mar Qtr 2020 Weighted average of eight capital cities % change % change All groups CPI 0.3 2.2 Food and non-alcoholic beverages 1.9 3.2 Alcohol and tobacco 1.6 7.9 Clothing and footwear -0.7 2.0 Housing 0.3 0.6 Furnishings, household equipment and services 0.8 2.2 Health 1.7 2.9 Transport -1.9 2.6 Communication -0.3 -3.4 Recreation and culture -1.7 1.3 Education 2.6 2.7 Insurance and financial services 0.7 1.6 CPI analytical series All groups CPI, seasonally adjusted 0.4 2.2 Trimmed mean 0.5 1.8 Weighted median 0.5 1.7

Step by Step Solution

There are 3 Steps involved in it

Step: 1

blur-text-image

Get Instant Access to Expert-Tailored Solutions

See step-by-step solutions with expert insights and AI powered tools for academic success

Step: 2

blur-text-image

Step: 3

blur-text-image

Ace Your Homework with AI

Get the answers you need in no time with our AI-driven, step-by-step assistance

Get Started

Recommended Textbook for

International Economics Theory and Policy

Authors: Paul R. Krugman, Maurice Obstfeld, Marc J. Melitz

9th Edition

978-0132146654, 0132146657, 9780273754091, 978-0273754206

More Books

Students also viewed these Economics questions

Question

What are the main sources of work-related stress?

Answered: 1 week ago