Question
Aim: Understanding the drivers of market value of each companys stock Apply Gordons framework to justify the relative valuation of Amar Raja batteries and Exide

 Aim: Understanding the drivers of market value of each companys stock
Apply Gordons framework to justify the relative valuation of Amar Raja batteries and Exide Industries Limited qualitatively with reference to its growth, profitability (returns vis-a-vis cost of capital), growth sustainability, risk, and dividend payout/earnings retention. (400 words)
Explanation
The Gordons constant growth dividend discounting model provides a framework to understand the value of a stock.
Value of stock V = D1/(Ke-g)
If stock price is taken to be an indicator of stock value,
P = D1/(Ke-g)
P = E1 x dividend payout/(Ke g)
P/E1 = Dividend payout/(Ke-g)
where Ke of a stock depends upon its beta based on the CAPM and long term (sustainable) rate of growth = RoE x b
Thus the forward price earnings multiple of a stock increases with its growth and profitability, but decreases with its cost of equity, hence beta (the beta of the companies in turn depends upon their business cyclicality, operating leverage and financial leverage). The relationship with dividend payout is more complex highly profitable companies should retain more earnings and less profitable companies should maintain higher payout ratios according to the equation.
The Gordons model is simplistic and inappropriate for most Indian companies since constant growth assumption does not hold and because using dividend has several limitations. Still, the relationships with the determinants mentioned above remain valid even if we use the more appropriate multi-stage discounted cashflow models.
You are expected to validate qualitatively, whether or not the differences or rank order in the above determinants can broadly explain the differences or rank order in price to earnings multiple between the two stocks as well as vis-a-vis other sector peers. This module does not require you to value the company using Gordons model or any other method, but only analyse and provide qualitative explanation and comments.
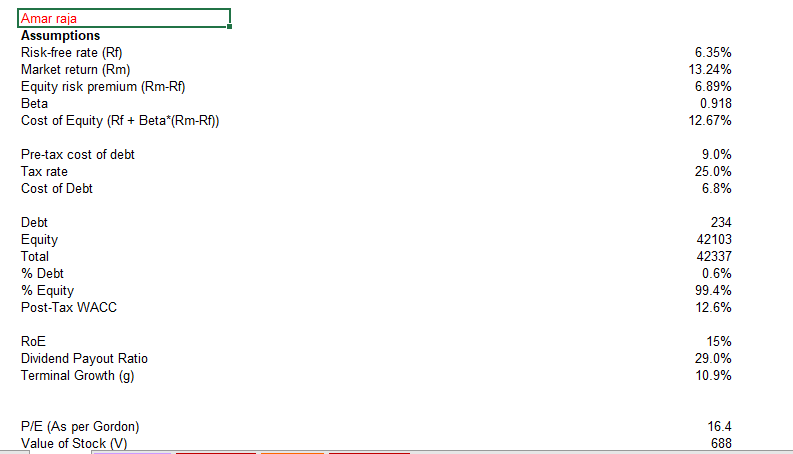
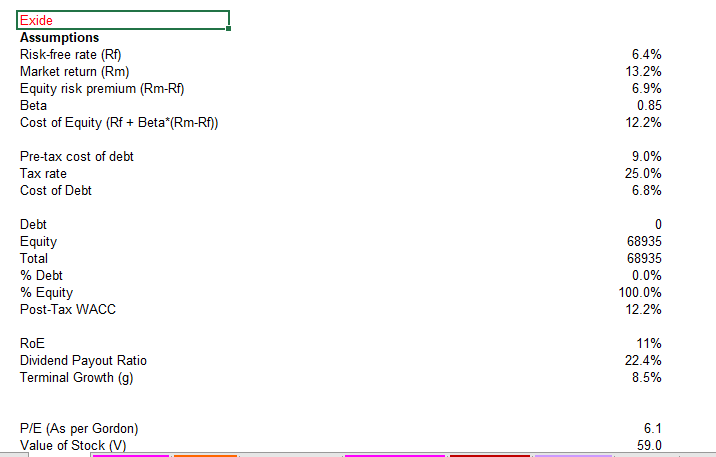
Amar raja Assumptions Risk-free rate (RF) Market return (Rm) Equity risk premium (Rm-Rf) Beta Cost of Equity (Rf + Beta*(Rm-Rf)) 6.35% 13.24% 6.89% 0.918 12.67% Pre-tax cost of debt Tax rate Cost of Debt 9.0% 25.0% 6.8% Debt Equity Total % Debt % Equity Post-Tax WACC 234 42103 42337 0.6% 99.4% 12.6% RoE Dividend Payout Ratio Terminal Growth (9) 15% 29.0% 10.9% P/E (As per Gordon) Value of Stock (V) 16.4 688 Exide Assumptions Risk-free rate (RF) Market return (Rm) Equity risk premium (Rm-Rf) Beta Cost of Equity (Rf + Beta*(Rm-Rf)) 6.4% 13.2% 6.9% 0.85 12.2% Pre-tax cost of debt Tax rate Cost of Debt 9.0% 25.0% 6.8% Debt Equity Total % Debt % Equity Post-Tax WACC 68935 68935 0.0% 100.0% 12.2% RoE Dividend Payout Ratio Terminal Growth (9) 11% 22.4% 8.5% P/E (As per Gordon) Value of Stock (V) 6.1 59.0 Amar raja Assumptions Risk-free rate (RF) Market return (Rm) Equity risk premium (Rm-Rf) Beta Cost of Equity (Rf + Beta*(Rm-Rf)) 6.35% 13.24% 6.89% 0.918 12.67% Pre-tax cost of debt Tax rate Cost of Debt 9.0% 25.0% 6.8% Debt Equity Total % Debt % Equity Post-Tax WACC 234 42103 42337 0.6% 99.4% 12.6% RoE Dividend Payout Ratio Terminal Growth (9) 15% 29.0% 10.9% P/E (As per Gordon) Value of Stock (V) 16.4 688 Exide Assumptions Risk-free rate (RF) Market return (Rm) Equity risk premium (Rm-Rf) Beta Cost of Equity (Rf + Beta*(Rm-Rf)) 6.4% 13.2% 6.9% 0.85 12.2% Pre-tax cost of debt Tax rate Cost of Debt 9.0% 25.0% 6.8% Debt Equity Total % Debt % Equity Post-Tax WACC 68935 68935 0.0% 100.0% 12.2% RoE Dividend Payout Ratio Terminal Growth (9) 11% 22.4% 8.5% P/E (As per Gordon) Value of Stock (V) 6.1 59.0Step by Step Solution
There are 3 Steps involved in it
Step: 1

Get Instant Access to Expert-Tailored Solutions
See step-by-step solutions with expert insights and AI powered tools for academic success
Step: 2

Step: 3

Ace Your Homework with AI
Get the answers you need in no time with our AI-driven, step-by-step assistance
Get Started


