

Answered step by step
Verified Expert Solution
Question
1 Approved Answer
Air Pollution control 1. Suppose the following atmospheric altitude versus temperature data have been collected Altitude (m) 0 75 150 225 300 375 450 525
Air Pollution control 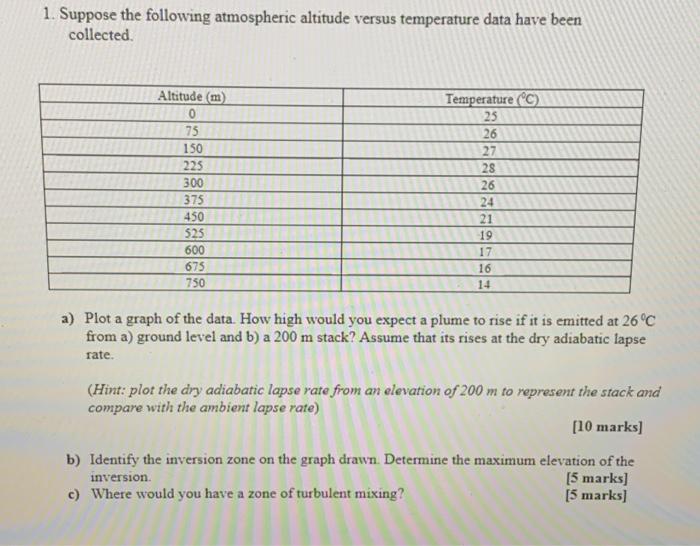
1. Suppose the following atmospheric altitude versus temperature data have been collected Altitude (m) 0 75 150 225 300 375 450 525 600 675 750 Temperature C) 25 26 27 28 26 24 21 19 17 16 14 a) Plot a graph of the data. How high would you expect a plume to rise if it is emitted at 26C from a) ground level and b) a 200 m stack? Assume that its rises at the dry adiabatic lapse rate. (Hint: plot the dry adiabatic lapse rate from an elevation of 200 m to represent the stack and compare with the ambient lapse rate) [10 marks] b) Identify the inversion zone on the graph drawn. Determine the maximum elevation of the [5 marks] c) Where would you have a zone of turbulent mixing? [5 marks) inversion Step by Step Solution
There are 3 Steps involved in it
Step: 1

Get Instant Access to Expert-Tailored Solutions
See step-by-step solutions with expert insights and AI powered tools for academic success
Step: 2

Step: 3
Ace Your Homework with AI
Get the answers you need in no time with our AI-driven, step-by-step assistance
Get Started
Principles and Modern Applications of Mass Transfer Operations
Authors: Jaime Benitez
2nd edition
470181788, 470181782, 978-1-119-0427, 978-0470181782