Answered step by step
Verified Expert Solution
Link Copied!

Question

1 Approved Answer

air voids Stability VMA Flow VFA Asphalt Content 5 5.5 6 6.5 7 6.46 4.58 2.49 1.93 2.02 1646 1755 1795 1642.3333 1308 Asphalt Content

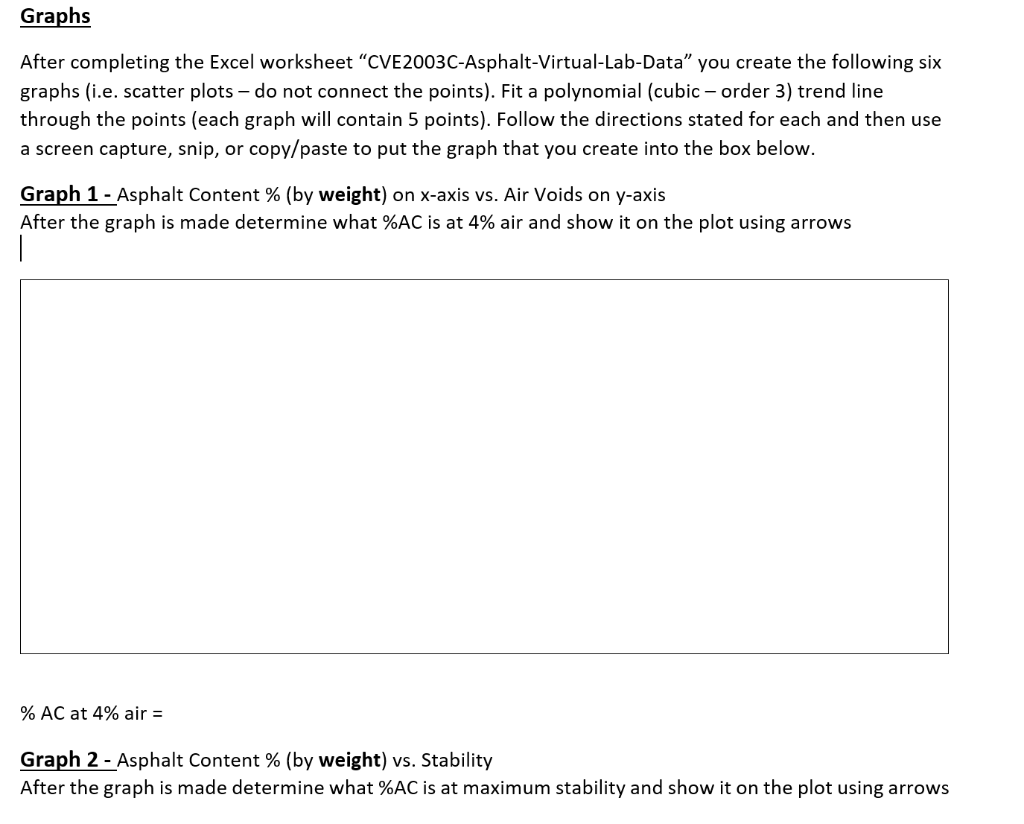
image text in transcribedimage text in transcribed

air voids Stability VMA Flow VFA Asphalt Content 5 5.5 6 6.5 7 6.46 4.58 2.49 1.93 2.02 1646 1755 1795 1642.3333 1308 Asphalt Content % 153.3825 155.25228 157.44168 157.12906 155.807 18.06 17.5 16.78 17.39 18.52 10 12 13 16.333333 17.333333 64.24 73.83 85.18 88.88 89.11 Graphs After completing the Excel worksheet CVE2003C-Asphalt-Virtual-Lab-Data" you create the following six graphs (i.e. scatter plots - do not connect the points). Fit a polynomial (cubic - order 3) trend line through the points (each graph will contain 5 points). Follow the directions stated for each and then use a screen capture, snip, or copy/paste to put the graph that you create into the box below. Graph 1 - Asphalt Content % (by weight) on x-axis vs. Air Voids on y-axis After the graph is made determine what %AC is at 4% air and show it on the plot using arrows % AC at 4% air = Graph 2 - Asphalt Content % (by weight) vs. Stability After the graph is made determine what %AC is at maximum stability and show it on the plot using arrows

Step by Step Solution

There are 3 Steps involved in it

Step: 1

blur-text-image

Get Instant Access to Expert-Tailored Solutions

See step-by-step solutions with expert insights and AI powered tools for academic success

Step: 2

blur-text-image

Step: 3

blur-text-image

Ace Your Homework with AI

Get the answers you need in no time with our AI-driven, step-by-step assistance

Get Started

Recommended Textbook for

More Books

Students also viewed these Accounting questions

Question

Depletion: Are the estimates of recoverable reserves reasonable?

Answered: 1 week ago