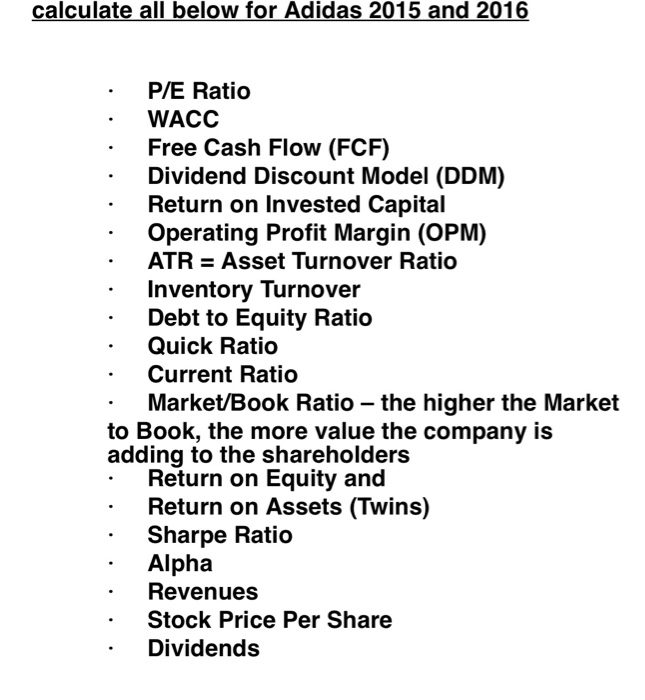
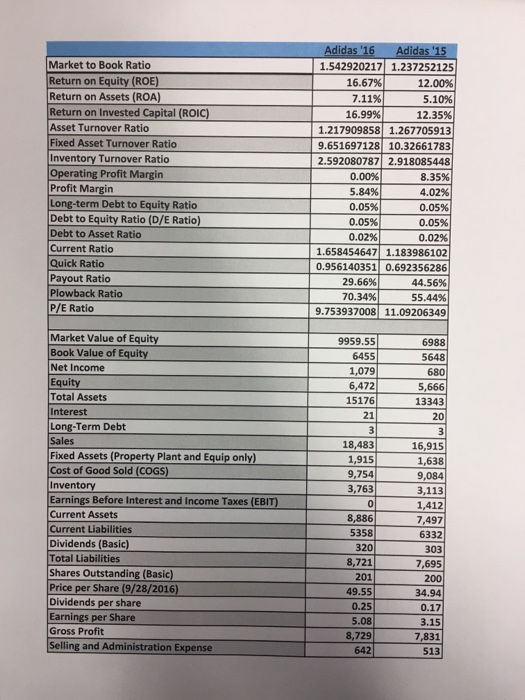
alculate all below for Adidas 2015 and 201 P/E Ratio WACC Free Cash Flow (FCF) Dividend Discount Model (DDM) Return on Invested Capital Operating Profit Margin (OPM) ATR = Asset Turnover Ratio Inventory Turnover Debt to Equity Ratio Quick Ratio Current Ratio Market/Book Ratio - the higher the Market to Book, the more value the company is adding to the shareholder:s Return on Equity and Return on Assets (Twins) Sharpe Ratio Alpha Revenues Stock Price Per Share Dividends Adidas '16Adidas '19 1.542920217 1.237252125 12.00% 5.10% 16.99%) 12.35% 1.217909858 1.267705913 9.651697128 10.32661783 2.592080787 2.918085448 8.35% 4.02% 0.05%) 0.05% 0.02% 1.658454647 1.183986102 0.956140351 0.692356286 44.56% 55.44% 9.753937008 11.09206349 Market to Book Ratio Return on Equity (ROE) Return on Assets (ROA) Return on Invested Capital (ROIC) Asset Turnover Ratio Fixed Asset Turnover Ratio Inventory Turnover Ratio Operating Profit Margin Profit Margin Long-term Debt to Equity Ratio Debt to Equity Ratio (D/E Ratio Debt to Asset Ratio Current Ratio Quick Ratio Payout Ratio Plowback Ratio P/E Ratio 16.67% 7.11% 0.00% 5.84% 0.05% 0.05% 0.02% 29.66% 70.34% Market Value of Equity Book Value of Equity Net Income 9959.55 6455 1,079 6,472 15176 21 6988 5648 680 5,666 13343 20 Total Assets Interest Long-Term Debt Sales Fixed Assets (Property Plant and Equip only) Cost of Good Sold (COGS) Inventory Earnings Before Interest and Income Taxes (EBIT) Current Assets Current Liabilities Dividends (Basic) Total Liabilities Shares Outstanding (Basic) Price per Share (9/28/2016) Dividends per share Earnings per Share Gross Profit Selling and Administration Expense 18,483 ,915 9,754 3,763 16,915 1,638 9,084 3,113 1,412 7,497 6332 303 7,695 200 34.94 0.17 3.15 7,831 513 8,886 5358 320 8,721 201 49.55 0.25 5.08 8,729 642 alculate all below for Adidas 2015 and 201 P/E Ratio WACC Free Cash Flow (FCF) Dividend Discount Model (DDM) Return on Invested Capital Operating Profit Margin (OPM) ATR = Asset Turnover Ratio Inventory Turnover Debt to Equity Ratio Quick Ratio Current Ratio Market/Book Ratio - the higher the Market to Book, the more value the company is adding to the shareholder:s Return on Equity and Return on Assets (Twins) Sharpe Ratio Alpha Revenues Stock Price Per Share Dividends Adidas '16Adidas '19 1.542920217 1.237252125 12.00% 5.10% 16.99%) 12.35% 1.217909858 1.267705913 9.651697128 10.32661783 2.592080787 2.918085448 8.35% 4.02% 0.05%) 0.05% 0.02% 1.658454647 1.183986102 0.956140351 0.692356286 44.56% 55.44% 9.753937008 11.09206349 Market to Book Ratio Return on Equity (ROE) Return on Assets (ROA) Return on Invested Capital (ROIC) Asset Turnover Ratio Fixed Asset Turnover Ratio Inventory Turnover Ratio Operating Profit Margin Profit Margin Long-term Debt to Equity Ratio Debt to Equity Ratio (D/E Ratio Debt to Asset Ratio Current Ratio Quick Ratio Payout Ratio Plowback Ratio P/E Ratio 16.67% 7.11% 0.00% 5.84% 0.05% 0.05% 0.02% 29.66% 70.34% Market Value of Equity Book Value of Equity Net Income 9959.55 6455 1,079 6,472 15176 21 6988 5648 680 5,666 13343 20 Total Assets Interest Long-Term Debt Sales Fixed Assets (Property Plant and Equip only) Cost of Good Sold (COGS) Inventory Earnings Before Interest and Income Taxes (EBIT) Current Assets Current Liabilities Dividends (Basic) Total Liabilities Shares Outstanding (Basic) Price per Share (9/28/2016) Dividends per share Earnings per Share Gross Profit Selling and Administration Expense 18,483 ,915 9,754 3,763 16,915 1,638 9,084 3,113 1,412 7,497 6332 303 7,695 200 34.94 0.17 3.15 7,831 513 8,886 5358 320 8,721 201 49.55 0.25 5.08 8,729 642