

Answered step by step
Verified Expert Solution
Question
1 Approved Answer
ALL ALL FORMULAS MUST BE SHOWN 1) Use the budget assumptions, along with Excel formulas, to populate the Master Budget column. Note: Your formulas must

 ALL
ALL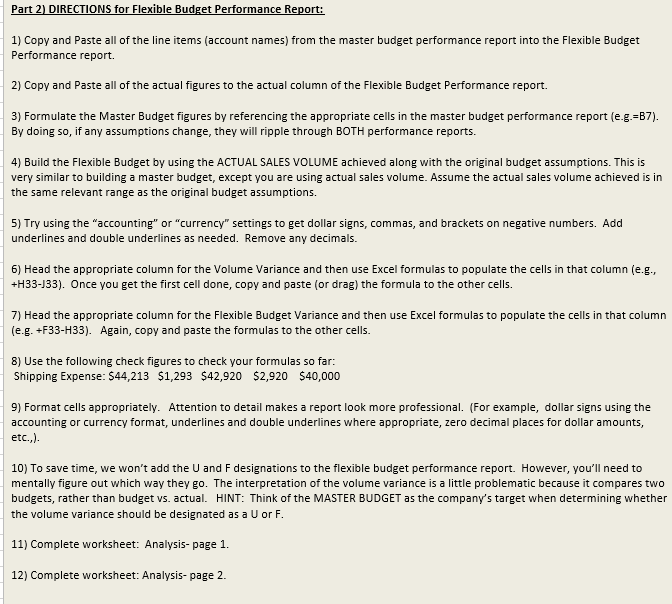
ALL FORMULAS MUST BE SHOWN
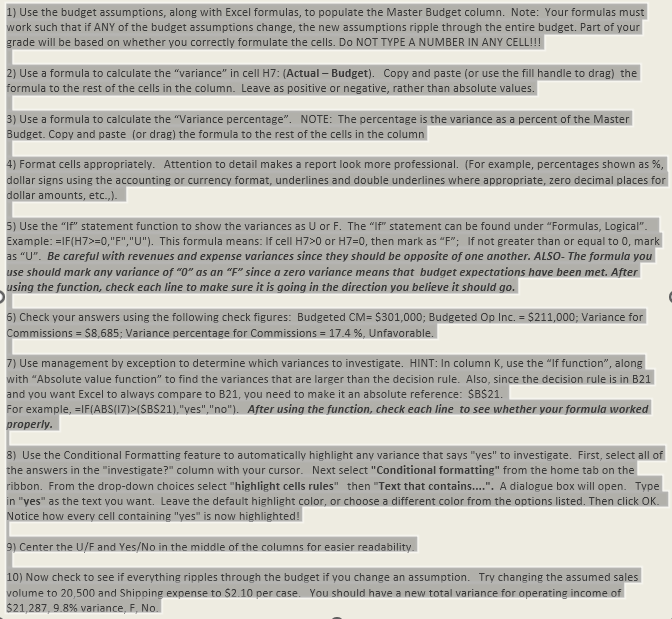
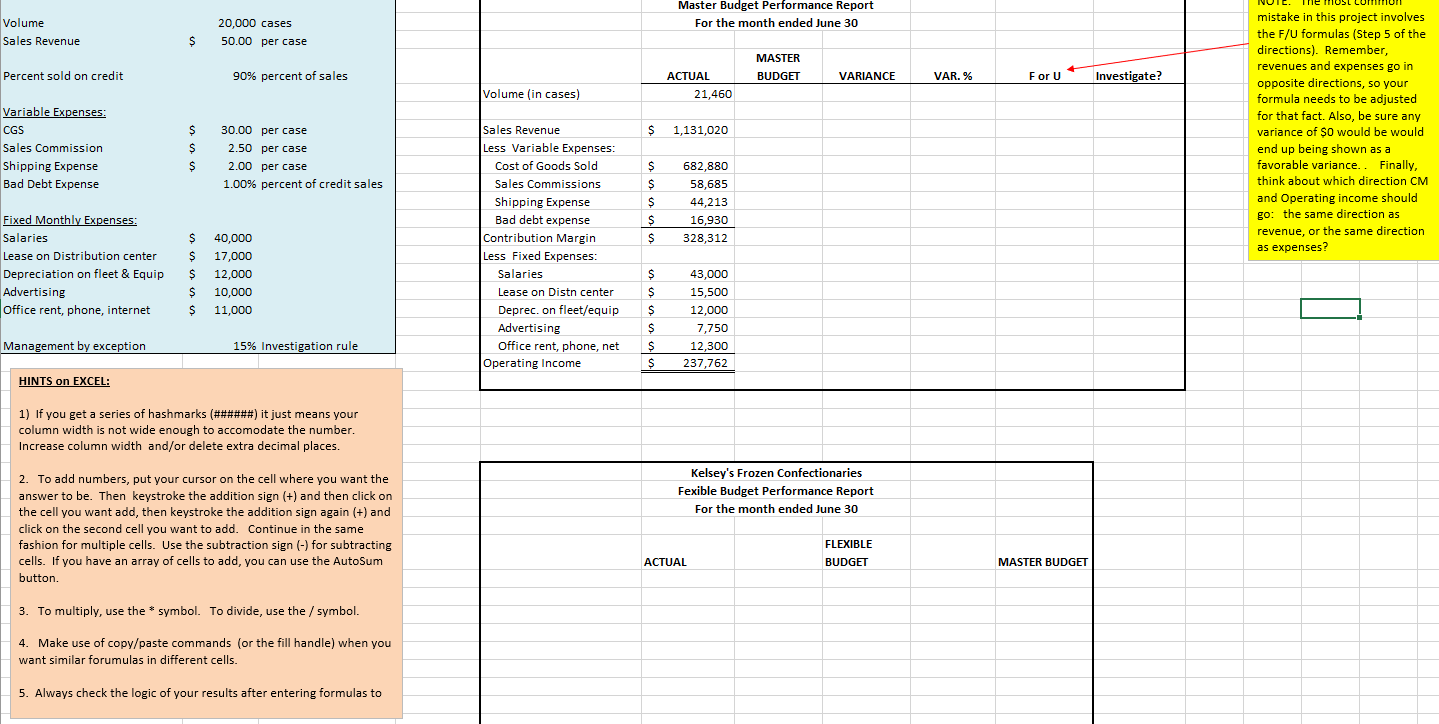
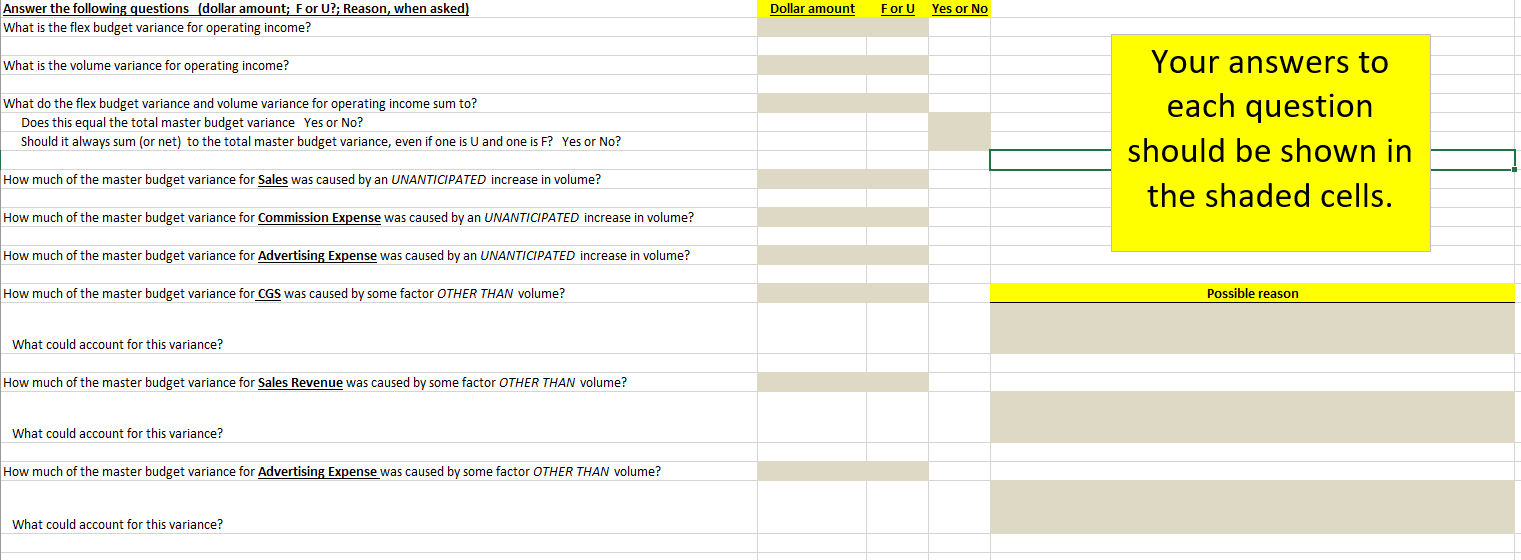
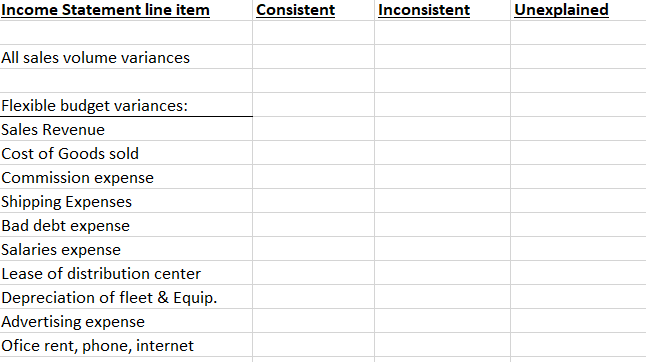
1) Use the budget assumptions, along with Excel formulas, to populate the Master Budget column. Note: Your formulas must work such that if ANY of the budget assumptions change, the new assumptions ripple through the entire budget. Part of your grade will be based on whether you correctly formulate the cells. Do NOT TYPE A NUMBER IN ANY CELL!!! 2) Use a formula to calculate the "variance" in cell H7: (Actual - Budget). Copy and paste (or use the fill handle to drag) the formula to the rest of the cells in the column. Leave as positive or negative, rather than absolute values. 3) Use a formula to calculate the "Variance percentage". NOTE: The percentage is the variance as a percent of the Master Budget. Copy and paste (or drag) the formula to the rest of the cells in the column 4) Format cells appropriately. Attention to detail makes a report look more professional. (For example, percentages shown as \%, dollar signs using the accounting or currency format, underlines and double underlines where appropriate, zero decimal places for dollar amounts, etc.,-). 5) Use the "If" statement function to show the variances as U or F. The "If" statement can be found under "Formulas, Logical". Example: =IF(H7>=0,"F",U"). This formula means: If cell H7>0 or H7=0, then mark as " F "; If not greater than or equal to 0 , mark as "U". Be careful with revenues and expense variances since they should be opposite of one another. ALSO-The formula you use should mark any variance of "0" as an " F " since a zero variance means that budget expectations have been met. After using the function, check each line to make sure it is going in the direction you believe it should go. 6) Check your answers using the following check figures: Budgeted CM=$301,000; Budgeted Op Inc. = \$211,000; Variance for Commissions =$8,685; Variance percentage for Commissions =17.4%, Unfavorable. 7) Use management by exception to determine which variances to investigate. HINT: In column K, use the "If function", along with "Absolute value function" to find the variances that are larger than the decision rule. Also, since the decision rule is in B21 and you want Excel to always compare to B21, you need to make it an absolute reference: $B$21. For example, = IF(ABS (I7)>(SBS21),"yes","no"). After using the function, check each line to see whether your formula worked properly. 8) Use the Conditional Formatting feature to automatically highlight any variance that says "yes" to investigate. First, select all of the answers in the "investigate?" column with your cursor. Next select "Conditional formatting" from the home tab on the ribbon. From the drop-down choices select "highlight cells rules" then "Text that contains...". A dialogue box will open. Type in "yes" as the text you want. Leave the default highlight color, or choose a different color from the options listed. Then click OK. Notice how every cell containing "yes" is now highlighted! 9) Center the U/F and Yes/No in the middle of the columns for easier readability. 10) Now check to see if everything ripples through the budget if you change an assumption. Try changing the assumed sales volume to 20,500 and Shipping expense to 52.10 per case. You should have a new total variance for operating income of $21,287,9.8% variance, F, No. Answer the following questions (dollar amount; F or U?; Reason, when asked) Dollar amount F or U Yes or No What is the volume variance for operating income? Your answers to What do the flex budget variance and volume variance for operating income sum to? each question Does this equal the total master budget variance Yes or No? Should it always sum (or net) to the total master budget variance, even if one is U and one is F? Yes or No? should be shown in the shaded cells. How much of the master budget variance for Advertising Expense was caused by an UNANTICIPATED increase in volume? How much of the master budget variance for CGS was caused by some factor OTHER THAN volume? Possible reason What could account for this variance? How much of the master budget variance for Sales Revenue was caused by some factor OTHER THAN volume? What could account for this variance? How much of the master budget variance for Advertising Expense was caused by some factor OTHER THAN volume? What could account for this variance? Answer the following questions (dollar amount; F or U?; Reason, when asked) Dollar amount F or U Yes or No What is the volume variance for operating income? Your answers to What do the flex budget variance and volume variance for operating income sum to? each question Does this equal the total master budget variance Yes or No? Should it always sum (or net) to the total master budget variance, even if one is U and one is F? Yes or No? should be shown in the shaded cells. How much of the master budget variance for Advertising Expense was caused by an UNANTICIPATED increase in volume? How much of the master budget variance for CGS was caused by some factor OTHER THAN volume? Possible reason What could account for this variance? How much of the master budget variance for Sales Revenue was caused by some factor OTHER THAN volume? What could account for this variance? How much of the master budget variance for Advertising Expense was caused by some factor OTHER THAN volume? What could account for this variance? Income Statement line item Consistent Inconsistent Unexplained All sales volume variances Flexible budget variances: Sales Revenue Cost of Goods sold Commission expense Shipping Expenses Bad debt expense Salaries expense Lease of distribution center Depreciation of fleet \& Equip. Advertising expense Ofice rent, phone, internet 1) Copy and Paste all of the line items (account names) from the master budget performance report into the Flexible Budget Performance report. 2) Copy and Paste all of the actual figures to the actual column of the Flexible Budget Performance report. 3) Formulate the Master Budget figures by referencing the appropriate cells in the master budget performance report (e.g.=B7). By doing so, if any assumptions change, they will ripple through BOTH performance reports. 4) Build the Flexible Budget by using the ACTUAL SALES VOLUME achieved along with the original budget assumptions. This is very similar to building a master budget, except you are using actual sales volume. Assume the actual sales volume achieved is in the same relevant range as the original budget assumptions. 5) Try using the "accounting" or "currency" settings to get dollar signs, commas, and brackets on negative numbers. Add underlines and double underlines as needed. Remove any decimals. 6) Head the appropriate column for the Volume Variance and then use Excel formulas to populate the cells in that column (e.g., + H33-J33). Once you get the first cell done, copy and paste (or drag) the formula to the other cells. 7) Head the appropriate column for the Flexible Budget Variance and then use Excel formulas to populate the cells in that column (e.g. +F33-H33). Again, copy and paste the formulas to the other cells. 8) Use the following check figures to check your formulas so far: Shipping Expense: $44,213$1,293$42,920$2,920$40,000 9) Format cells appropriately. Attention to detail makes a report look more professional. (For example, dollar signs using the accounting or currency format, underlines and double underlines where appropriate, zero decimal places for dollar amounts, etc.,). 10) To save time, we won't add the U and F designations to the flexible budget performance report. However, you'll need to mentally figure out which way they go. The interpretation of the volume variance is a little problematic because it compares two budgets, rather than budget vs. actual. HINT: Think of the MASTER BUDGET as the company's target when determining whether the volume variance should be designated as a U or F. 11) Complete worksheet: Analysis- page 1. 12) Complete worksheet: Analysis- page 2. 1) Use the budget assumptions, along with Excel formulas, to populate the Master Budget column. Note: Your formulas must work such that if ANY of the budget assumptions change, the new assumptions ripple through the entire budget. Part of your grade will be based on whether you correctly formulate the cells. Do NOT TYPE A NUMBER IN ANY CELL!!! 2) Use a formula to calculate the "variance" in cell H7: (Actual - Budget). Copy and paste (or use the fill handle to drag) the formula to the rest of the cells in the column. Leave as positive or negative, rather than absolute values. 3) Use a formula to calculate the "Variance percentage". NOTE: The percentage is the variance as a percent of the Master Budget. Copy and paste (or drag) the formula to the rest of the cells in the column 4) Format cells appropriately. Attention to detail makes a report look more professional. (For example, percentages shown as \%, dollar signs using the accounting or currency format, underlines and double underlines where appropriate, zero decimal places for dollar amounts, etc.,-). 5) Use the "If" statement function to show the variances as U or F. The "If" statement can be found under "Formulas, Logical". Example: =IF(H7>=0,"F",U"). This formula means: If cell H7>0 or H7=0, then mark as " F "; If not greater than or equal to 0 , mark as "U". Be careful with revenues and expense variances since they should be opposite of one another. ALSO-The formula you use should mark any variance of "0" as an " F " since a zero variance means that budget expectations have been met. After using the function, check each line to make sure it is going in the direction you believe it should go. 6) Check your answers using the following check figures: Budgeted CM=$301,000; Budgeted Op Inc. = \$211,000; Variance for Commissions =$8,685; Variance percentage for Commissions =17.4%, Unfavorable. 7) Use management by exception to determine which variances to investigate. HINT: In column K, use the "If function", along with "Absolute value function" to find the variances that are larger than the decision rule. Also, since the decision rule is in B21 and you want Excel to always compare to B21, you need to make it an absolute reference: $B$21. For example, = IF(ABS (I7)>(SBS21),"yes","no"). After using the function, check each line to see whether your formula worked properly. 8) Use the Conditional Formatting feature to automatically highlight any variance that says "yes" to investigate. First, select all of the answers in the "investigate?" column with your cursor. Next select "Conditional formatting" from the home tab on the ribbon. From the drop-down choices select "highlight cells rules" then "Text that contains...". A dialogue box will open. Type in "yes" as the text you want. Leave the default highlight color, or choose a different color from the options listed. Then click OK. Notice how every cell containing "yes" is now highlighted! 9) Center the U/F and Yes/No in the middle of the columns for easier readability. 10) Now check to see if everything ripples through the budget if you change an assumption. Try changing the assumed sales volume to 20,500 and Shipping expense to 52.10 per case. You should have a new total variance for operating income of $21,287,9.8% variance, F, No. Answer the following questions (dollar amount; F or U?; Reason, when asked) Dollar amount F or U Yes or No What is the volume variance for operating income? Your answers to What do the flex budget variance and volume variance for operating income sum to? each question Does this equal the total master budget variance Yes or No? Should it always sum (or net) to the total master budget variance, even if one is U and one is F? Yes or No? should be shown in the shaded cells. How much of the master budget variance for Advertising Expense was caused by an UNANTICIPATED increase in volume? How much of the master budget variance for CGS was caused by some factor OTHER THAN volume? Possible reason What could account for this variance? How much of the master budget variance for Sales Revenue was caused by some factor OTHER THAN volume? What could account for this variance? How much of the master budget variance for Advertising Expense was caused by some factor OTHER THAN volume? What could account for this variance? Answer the following questions (dollar amount; F or U?; Reason, when asked) Dollar amount F or U Yes or No What is the volume variance for operating income? Your answers to What do the flex budget variance and volume variance for operating income sum to? each question Does this equal the total master budget variance Yes or No? Should it always sum (or net) to the total master budget variance, even if one is U and one is F? Yes or No? should be shown in the shaded cells. How much of the master budget variance for Advertising Expense was caused by an UNANTICIPATED increase in volume? How much of the master budget variance for CGS was caused by some factor OTHER THAN volume? Possible reason What could account for this variance? How much of the master budget variance for Sales Revenue was caused by some factor OTHER THAN volume? What could account for this variance? How much of the master budget variance for Advertising Expense was caused by some factor OTHER THAN volume? What could account for this variance? Income Statement line item Consistent Inconsistent Unexplained All sales volume variances Flexible budget variances: Sales Revenue Cost of Goods sold Commission expense Shipping Expenses Bad debt expense Salaries expense Lease of distribution center Depreciation of fleet \& Equip. Advertising expense Ofice rent, phone, internet 1) Copy and Paste all of the line items (account names) from the master budget performance report into the Flexible Budget Performance report. 2) Copy and Paste all of the actual figures to the actual column of the Flexible Budget Performance report. 3) Formulate the Master Budget figures by referencing the appropriate cells in the master budget performance report (e.g.=B7). By doing so, if any assumptions change, they will ripple through BOTH performance reports. 4) Build the Flexible Budget by using the ACTUAL SALES VOLUME achieved along with the original budget assumptions. This is very similar to building a master budget, except you are using actual sales volume. Assume the actual sales volume achieved is in the same relevant range as the original budget assumptions. 5) Try using the "accounting" or "currency" settings to get dollar signs, commas, and brackets on negative numbers. Add underlines and double underlines as needed. Remove any decimals. 6) Head the appropriate column for the Volume Variance and then use Excel formulas to populate the cells in that column (e.g., + H33-J33). Once you get the first cell done, copy and paste (or drag) the formula to the other cells. 7) Head the appropriate column for the Flexible Budget Variance and then use Excel formulas to populate the cells in that column (e.g. +F33-H33). Again, copy and paste the formulas to the other cells. 8) Use the following check figures to check your formulas so far: Shipping Expense: $44,213$1,293$42,920$2,920$40,000 9) Format cells appropriately. Attention to detail makes a report look more professional. (For example, dollar signs using the accounting or currency format, underlines and double underlines where appropriate, zero decimal places for dollar amounts, etc.,). 10) To save time, we won't add the U and F designations to the flexible budget performance report. However, you'll need to mentally figure out which way they go. The interpretation of the volume variance is a little problematic because it compares two budgets, rather than budget vs. actual. HINT: Think of the MASTER BUDGET as the company's target when determining whether the volume variance should be designated as a U or F. 11) Complete worksheet: Analysis- page 1. 12) Complete worksheet: Analysis- page 2Step by Step Solution
There are 3 Steps involved in it
Step: 1

Get Instant Access to Expert-Tailored Solutions
See step-by-step solutions with expert insights and AI powered tools for academic success
Step: 2

Step: 3
Ace Your Homework with AI
Get the answers you need in no time with our AI-driven, step-by-step assistance
Get Started
Property Companies An Industry Accounting And Auditing Guide
Authors: Accountancy Books
1st Edition
1853558079, 978-1853558078