

Answered step by step
Verified Expert Solution
Question
1 Approved Answer
ALL ANSWERS MUST BE IN A FORMULA A E F . This Year ces Cash 54980,000 2.988000 1992.000 10 Inventory 1 Recent financial statements for
ALL ANSWERS MUST BE IN A FORMULA 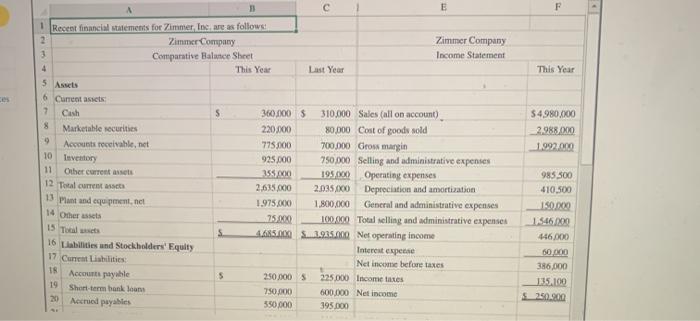
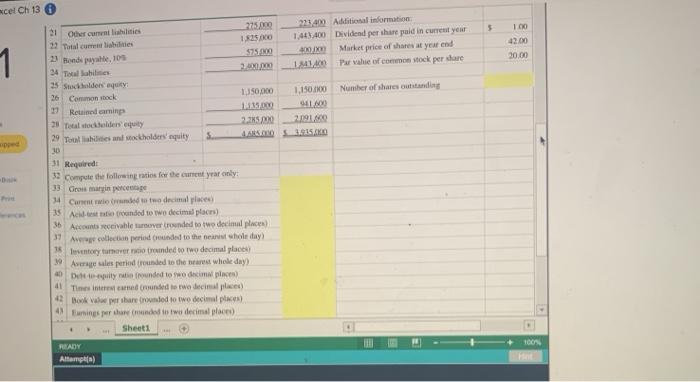
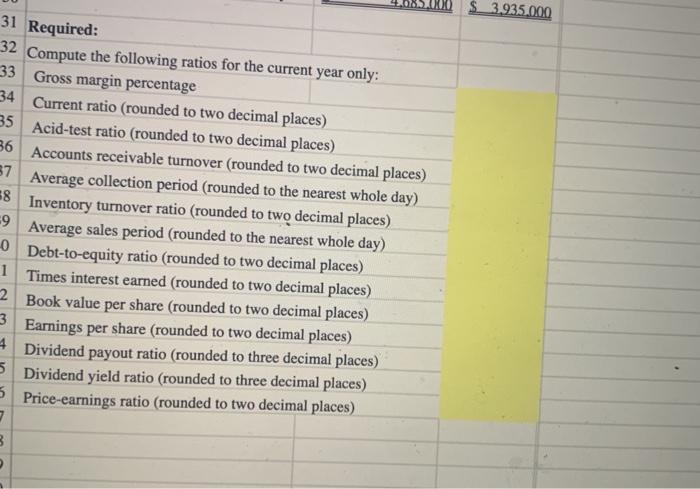
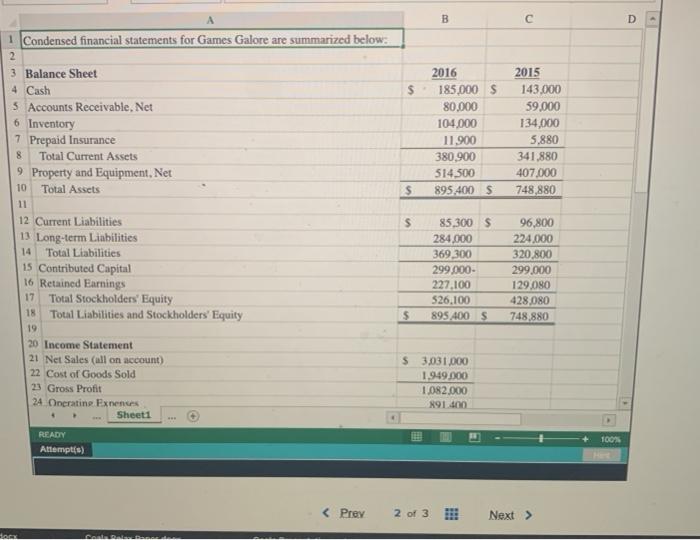
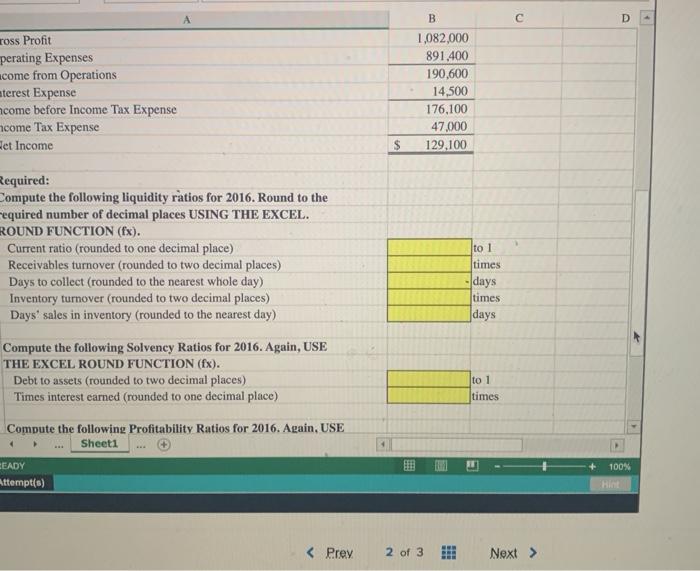
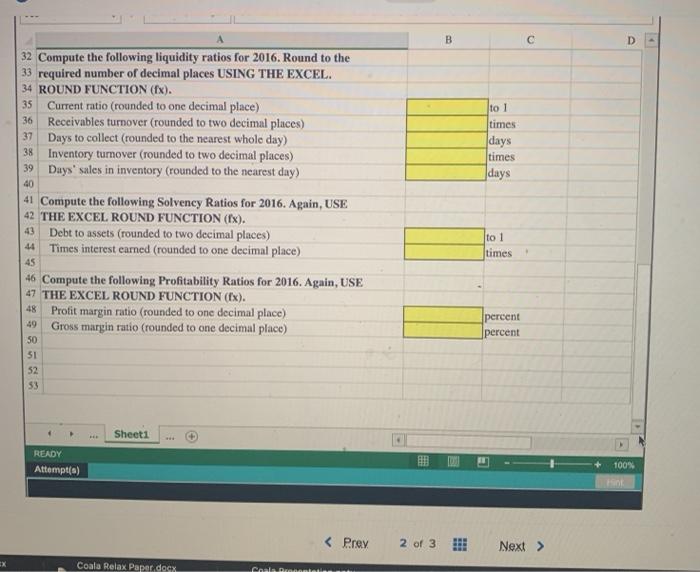
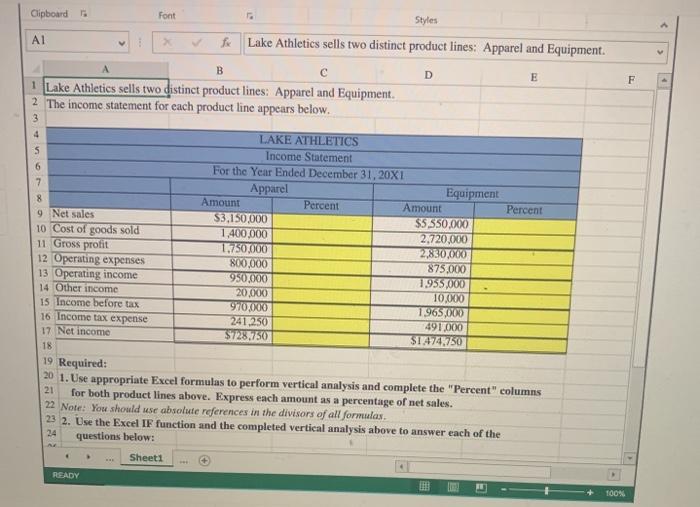
A E F . This Year ces Cash 54980,000 2.988000 1992.000 10 Inventory 1 Recent financial statements for Zimmer, Inc. are as follows: 2 Zimmer Company Zimmer Company 3 Comparative Balance Sheet Income Statement 4 This Year Last Year 5 Assets 6 Current assets 2 5 360.00 $ 310.000 Sales (all on account) Marketable securities 220,000 80,000 Cost of goods sold 9 Accounts receivable, niet 775200 700.000 Gross margin 925.000 750.000 Selling and administrative expenses 11 Other current at 355.000 195/60 Operating expenses 12 Total current asset 2,635.000 2035000 Depreciation and amortization 13 Pant and equipment, net 1.975.000 1,800,000 General and administrative expenses 75000 100.000 Total selling and administrative expenses S. 4.485.000 1.925.000 Net operating income 16 Liabilities and Stockholders' Equity Interest expense 17 Current Liabilities Net income before taxes 18 Accounts payable 5 250 2005 225.000 Income taxes 19 Short-term bank loan 750.000 600.000 Net Income 20 Accrued payables 350.000 395.000 985 300 410.500 50.00 1546/200 446000 14 Octs 15 Tocal 386,000 135.100 250.900 acel Ch 13 5 100 42.00 20.00 1 31 275100 22 Additional information Other curshiltis 32 Total cuales 1.250 1.4.400 Dividend per share paid in current year $75.000 Market price of shares at year end 21 Bondye 109 34 Total abilities 2010 141,400 Par vahie of common stock per dare 25. Stulders equity 36 Carmon stock 150.000 1.150.00 Number of shares outstanding 17 Ruined camin 11 0412 | tai gia khalifa 19 (1) 2.25 2.091 29 Toullies and stockholders' equity S USD 150 30 31 Required: 33 Compute the following ratios for the current year only 33 Gross margin percentage 34 Current mode to two decimal place) 35 Acided to two decimal places) 36 Accounts receivable surovered to the decimal places 37 Aer collection periodunded to the new whole day) 15 Inventory turnerer runded to two decimal places 19 Average sales period founded to the area whole day) pity in rounded to we decimal places) 41 Times intermed rounded to two decimal placed Book Valshare rounded to two decimal places A inspireranded to two decimal places) Sheets READY Altampa) 100 $ 3.935.000 31 Required: 32 Compute the following ratios for the current year only: 33 Gross margin percentage 34 Current ratio (rounded to two decimal places) 35 Acid-test ratio (rounded to two decimal places) 36 Accounts receivable turnover (rounded to two decimal places) 37 Average collection period (rounded to the nearest whole day) #8 Inventory turnover ratio (rounded to two decimal places) 59 Average sales period (rounded to the nearest whole day) 0 Debt-to-equity ratio (rounded to two decimal places) 1 Times interest earned (rounded to two decimal places) 2 Book value per share (rounded to two decimal places) 3 Earnings per share (rounded to two decimal places) 4 Dividend payout ratio (rounded to three decimal places) 5 Dividend yield ratio (rounded to three decimal places) 5 Price-earnings ratio (rounded to two decimal places) 7 3 B c D $ 2016 185.000 $ 80.000 104,000 11,900 380.900 514.500 895,400 $ 2015 143,000 59.000 134,000 5,880 341,880 407.000 748,880 s 1 Condensed financial statements for Games Galore are summarized below: 2 3 Balance Sheet 4 Cash 5 Accounts Receivable. Net 6 Inventory 7 Prepaid Insurance 8 Total Current Assets 9 Property and Equipment, Net 10 Total Assets 11 12 Current Liabilities 13 Long-term Liabilities 14 Total Liabilities 15 Contributed Capital 16 Retained Earnings 17 Total Stockholders' Equity 18 Total Liabilities and Stockholders' Equity 19 20 Income Statement 21 Net Sales (all on account) 22 Cost of Goods Sold 23 Gross Profit 24 Onerating Exnences Sheet1 $ 85,300 $ 284.000 369 300 299.000- 227,100 526.100 895 400 5 96,800 224,000 320.800 299.000 129080 428,080 748,880 $ $ 3.031.000 1.949.000 1.082.000 191.00 READY Attempt(s) 100% SRL A B D ross Profit perating Expenses come from Operations terest Expense come before Income Tax Expense come Tax Expense Pet Income 1,082,000 891.400 190,600 14,500 176,100 47.000 129,100 $ Required: Compute the following liquidity ratios for 2016. Round to the required number of decimal places USING THE EXCEL. ROUND FUNCTION (fx). Current ratio (rounded to one decimal place) Receivables turnover (rounded to two decimal places) Days to collect (rounded to the nearest whole day) Inventory turnover (rounded to two decimal places) Days' sales in inventory (rounded to the nearest day) to 1 times days times days Compute the following Solvency Ratios for 2016. Again, USE THE EXCEL ROUND FUNCTION (fx). Debt to assets (rounded to two decimal places) Times interest earned (rounded to one decimal place) to 1 times Compute the following Profitability Ratios for 2016. Again, USE Sheet1 E 100% BEADY Attempt(s) Hint B D . to 1 times days times days 40 32 Compute the following liquidity ratios for 2016. Round to the 33 required number of decimal places USING THE EXCEL. 34 ROUND FUNCTION (fx). 35 Current ratio (rounded to one decimal place) 36 Receivables turnover (rounded to two decimal places) 37 Days to collect (rounded to the nearest whole day) 38 Inventory turnover (rounded to two decimal places) 39 Days' sales in inventory (rounded to the nearest day) 41 Compute the following Solvency Ratios for 2016. Again, USE 42 THE EXCEL ROUND FUNCTION (fx). 43 Debt to assets (rounded to two decimal places) 44 Times interest earned (rounded to one decimal place) 45 46 Compute the following Profitability Ratios for 2016. Again, USE 47 THE EXCEL ROUND FUNCTION (Ex). Profit margin ratio (rounded to one decimal place) Gross margin ratio (rounded to one decimal place) to 1 times 48 49 percent percent 50 51 52 53 Sheet1 READY Attempt(a) 100% Prey 2 of 3 Next > Coala Relax Paper docx CD F . Clipboard Font Styles AI Lake Athletics sells two distinct product lines: Apparel and Equipment. B D E 1 Lake Athletics sells two distinct product lines: Apparel and Equipment 2. The income statement for each product line appears below. 3 4 LAKE ATHLETICS S Income Statement 6 For the Year Ended December 31, 20X1 7 Apparel Equipment 8 Amount Percent Amount Percent 9 Net sales $3,150.000 $5,550,000 10 Cost of goods sold 1,400,000 2.720.000 11 Gross profit 1.750.000 21830.000 12 Operating expenses 800.000 875.000 13 Operating income 950.000 1.955.000 14 Other income 20.000 10,000 15 Income before tax 970.000 1 965.000 16 Income tax expense 241.250 491.000 17 Net income $728.750 $147450 18 19 Required: 20 1. Use appropriate Excel formulas to perform vertical analysis and complete the "Percent" columns 21 for both product lines above. Express each amount as a percentage of net sales. 22 Note: You should use absolute references in the divisors of all formulas. 23 2. Use the Excel IF function and the completed vertical analysis above to answer each of the 24 questions below: Sheet1 READY 100% A E F . This Year ces Cash 54980,000 2.988000 1992.000 10 Inventory 1 Recent financial statements for Zimmer, Inc. are as follows: 2 Zimmer Company Zimmer Company 3 Comparative Balance Sheet Income Statement 4 This Year Last Year 5 Assets 6 Current assets 2 5 360.00 $ 310.000 Sales (all on account) Marketable securities 220,000 80,000 Cost of goods sold 9 Accounts receivable, niet 775200 700.000 Gross margin 925.000 750.000 Selling and administrative expenses 11 Other current at 355.000 195/60 Operating expenses 12 Total current asset 2,635.000 2035000 Depreciation and amortization 13 Pant and equipment, net 1.975.000 1,800,000 General and administrative expenses 75000 100.000 Total selling and administrative expenses S. 4.485.000 1.925.000 Net operating income 16 Liabilities and Stockholders' Equity Interest expense 17 Current Liabilities Net income before taxes 18 Accounts payable 5 250 2005 225.000 Income taxes 19 Short-term bank loan 750.000 600.000 Net Income 20 Accrued payables 350.000 395.000 985 300 410.500 50.00 1546/200 446000 14 Octs 15 Tocal 386,000 135.100 250.900 acel Ch 13 5 100 42.00 20.00 1 31 275100 22 Additional information Other curshiltis 32 Total cuales 1.250 1.4.400 Dividend per share paid in current year $75.000 Market price of shares at year end 21 Bondye 109 34 Total abilities 2010 141,400 Par vahie of common stock per dare 25. Stulders equity 36 Carmon stock 150.000 1.150.00 Number of shares outstanding 17 Ruined camin 11 0412 | tai gia khalifa 19 (1) 2.25 2.091 29 Toullies and stockholders' equity S USD 150 30 31 Required: 33 Compute the following ratios for the current year only 33 Gross margin percentage 34 Current mode to two decimal place) 35 Acided to two decimal places) 36 Accounts receivable surovered to the decimal places 37 Aer collection periodunded to the new whole day) 15 Inventory turnerer runded to two decimal places 19 Average sales period founded to the area whole day) pity in rounded to we decimal places) 41 Times intermed rounded to two decimal placed Book Valshare rounded to two decimal places A inspireranded to two decimal places) Sheets READY Altampa) 100 $ 3.935.000 31 Required: 32 Compute the following ratios for the current year only: 33 Gross margin percentage 34 Current ratio (rounded to two decimal places) 35 Acid-test ratio (rounded to two decimal places) 36 Accounts receivable turnover (rounded to two decimal places) 37 Average collection period (rounded to the nearest whole day) #8 Inventory turnover ratio (rounded to two decimal places) 59 Average sales period (rounded to the nearest whole day) 0 Debt-to-equity ratio (rounded to two decimal places) 1 Times interest earned (rounded to two decimal places) 2 Book value per share (rounded to two decimal places) 3 Earnings per share (rounded to two decimal places) 4 Dividend payout ratio (rounded to three decimal places) 5 Dividend yield ratio (rounded to three decimal places) 5 Price-earnings ratio (rounded to two decimal places) 7 3 B c D $ 2016 185.000 $ 80.000 104,000 11,900 380.900 514.500 895,400 $ 2015 143,000 59.000 134,000 5,880 341,880 407.000 748,880 s 1 Condensed financial statements for Games Galore are summarized below: 2 3 Balance Sheet 4 Cash 5 Accounts Receivable. Net 6 Inventory 7 Prepaid Insurance 8 Total Current Assets 9 Property and Equipment, Net 10 Total Assets 11 12 Current Liabilities 13 Long-term Liabilities 14 Total Liabilities 15 Contributed Capital 16 Retained Earnings 17 Total Stockholders' Equity 18 Total Liabilities and Stockholders' Equity 19 20 Income Statement 21 Net Sales (all on account) 22 Cost of Goods Sold 23 Gross Profit 24 Onerating Exnences Sheet1 $ 85,300 $ 284.000 369 300 299.000- 227,100 526.100 895 400 5 96,800 224,000 320.800 299.000 129080 428,080 748,880 $ $ 3.031.000 1.949.000 1.082.000 191.00 READY Attempt(s) 100% SRL A B D ross Profit perating Expenses come from Operations terest Expense come before Income Tax Expense come Tax Expense Pet Income 1,082,000 891.400 190,600 14,500 176,100 47.000 129,100 $ Required: Compute the following liquidity ratios for 2016. Round to the required number of decimal places USING THE EXCEL. ROUND FUNCTION (fx). Current ratio (rounded to one decimal place) Receivables turnover (rounded to two decimal places) Days to collect (rounded to the nearest whole day) Inventory turnover (rounded to two decimal places) Days' sales in inventory (rounded to the nearest day) to 1 times days times days Compute the following Solvency Ratios for 2016. Again, USE THE EXCEL ROUND FUNCTION (fx). Debt to assets (rounded to two decimal places) Times interest earned (rounded to one decimal place) to 1 times Compute the following Profitability Ratios for 2016. Again, USE Sheet1 E 100% BEADY Attempt(s) Hint B D . to 1 times days times days 40 32 Compute the following liquidity ratios for 2016. Round to the 33 required number of decimal places USING THE EXCEL. 34 ROUND FUNCTION (fx). 35 Current ratio (rounded to one decimal place) 36 Receivables turnover (rounded to two decimal places) 37 Days to collect (rounded to the nearest whole day) 38 Inventory turnover (rounded to two decimal places) 39 Days' sales in inventory (rounded to the nearest day) 41 Compute the following Solvency Ratios for 2016. Again, USE 42 THE EXCEL ROUND FUNCTION (fx). 43 Debt to assets (rounded to two decimal places) 44 Times interest earned (rounded to one decimal place) 45 46 Compute the following Profitability Ratios for 2016. Again, USE 47 THE EXCEL ROUND FUNCTION (Ex). Profit margin ratio (rounded to one decimal place) Gross margin ratio (rounded to one decimal place) to 1 times 48 49 percent percent 50 51 52 53 Sheet1 READY Attempt(a) 100% Prey 2 of 3 Next > Coala Relax Paper docx CD F . Clipboard Font Styles AI Lake Athletics sells two distinct product lines: Apparel and Equipment. B D E 1 Lake Athletics sells two distinct product lines: Apparel and Equipment 2. The income statement for each product line appears below. 3 4 LAKE ATHLETICS S Income Statement 6 For the Year Ended December 31, 20X1 7 Apparel Equipment 8 Amount Percent Amount Percent 9 Net sales $3,150.000 $5,550,000 10 Cost of goods sold 1,400,000 2.720.000 11 Gross profit 1.750.000 21830.000 12 Operating expenses 800.000 875.000 13 Operating income 950.000 1.955.000 14 Other income 20.000 10,000 15 Income before tax 970.000 1 965.000 16 Income tax expense 241.250 491.000 17 Net income $728.750 $147450 18 19 Required: 20 1. Use appropriate Excel formulas to perform vertical analysis and complete the "Percent" columns 21 for both product lines above. Express each amount as a percentage of net sales. 22 Note: You should use absolute references in the divisors of all formulas. 23 2. Use the Excel IF function and the completed vertical analysis above to answer each of the 24 questions below: Sheet1 READY 100% Step by Step Solution
There are 3 Steps involved in it
Step: 1

Get Instant Access to Expert-Tailored Solutions
See step-by-step solutions with expert insights and AI powered tools for academic success
Step: 2

Step: 3
Ace Your Homework with AI
Get the answers you need in no time with our AI-driven, step-by-step assistance
Get Started
Bond Markets Analysis and Strategies
Authors: Frank J.Fabozzi
9th edition
133796779, 978-0133796773