

Answered step by step
Verified Expert Solution
Question
1 Approved Answer
All part of the sane graph It is in multiples of 10 Table 3.5. Mass and Volume of Unknown Liquid. Liquid Additions Liquid Addition 1
All part of the sane graph 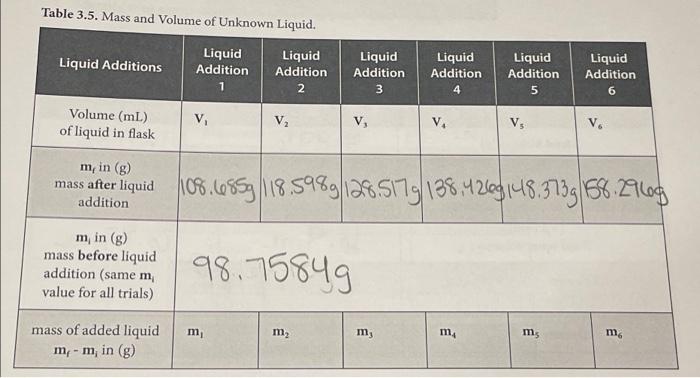
It is in multiples of 10
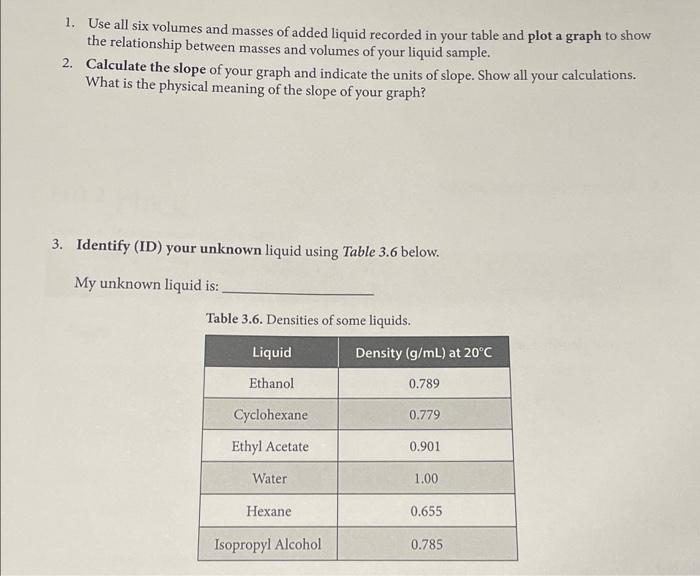
Table 3.5. Mass and Volume of Unknown Liquid. Liquid Additions Liquid Addition 1 Liquid Addition 2 Liquid Addition 3 Liquid Addition 4 Liquid Addition 5 Liquid Addition Volume (ml.) of liquid in flask v. V V V. V, V m, in (g) mas after liquid 108.60859118.5989|128.5179 138.429 148.3739158.27log m in (8) mass before liquid addition (same m value for all trials) 98.75849 m m2 m my ms mass of added liquid m-m, in () m. 1. Use all six volumes and masses of added liquid recorded in your table and plot a graph to show the relationship between masses and volumes of your liquid sample. 2. Calculate the slope of your graph and indicate the units of slope. Show all your calculations. What is the physical meaning of the slope of your graph? 3. Identify (ID) your unknown liquid using Table 3.6 below. My unknown liquid is: Table 3.6. Densities of some liquids. Liquid Density (g/mL) at 20C Ethanol 0.789 Cyclohexane 0.779 Ethyl Acetate 0.901 Water 1.00 Hexane 0.655 Isopropyl Alcohol 0.785 Step by Step Solution
There are 3 Steps involved in it
Step: 1

Get Instant Access to Expert-Tailored Solutions
See step-by-step solutions with expert insights and AI powered tools for academic success
Step: 2

Step: 3
Ace Your Homework with AI
Get the answers you need in no time with our AI-driven, step-by-step assistance
Get Started
Chemical Technicians Ready Reference Handbook
Authors: Jack T. Ballinger , Gershon J. Shugar
5th Edition
0071745920, 9780071745925