

Answered step by step
Verified Expert Solution
Question
1 Approved Answer
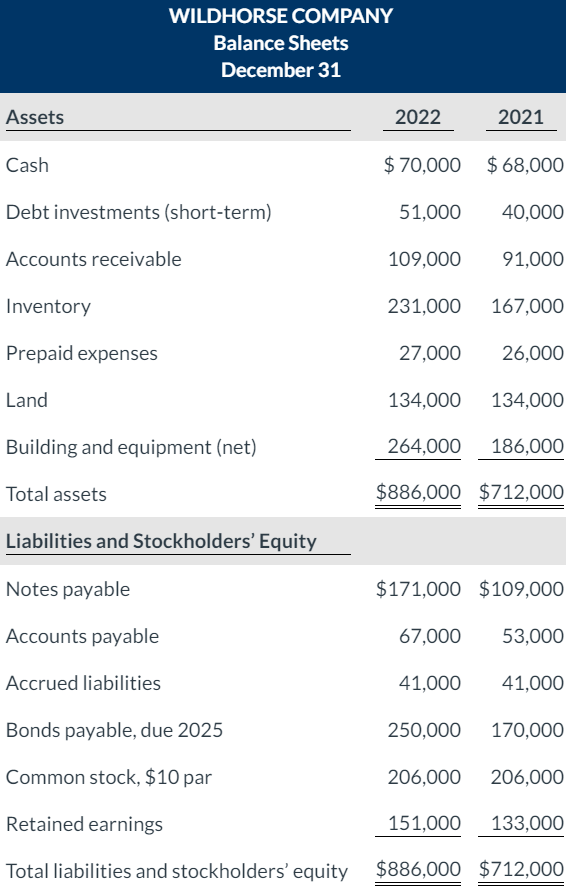
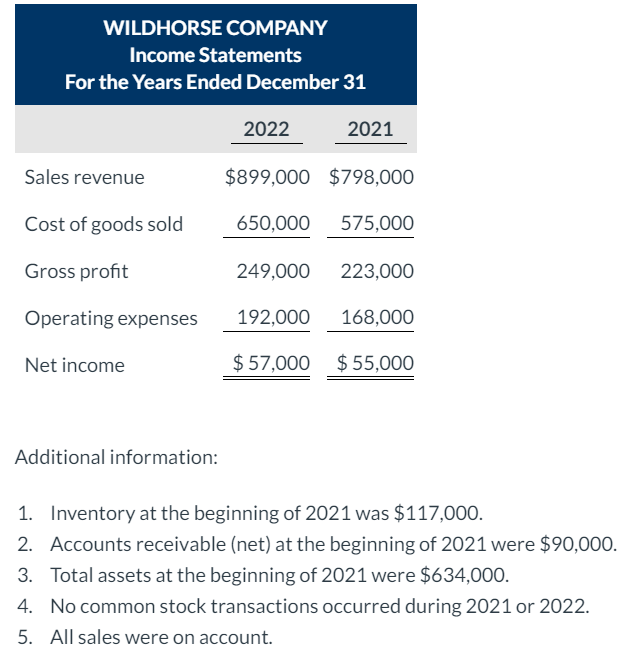
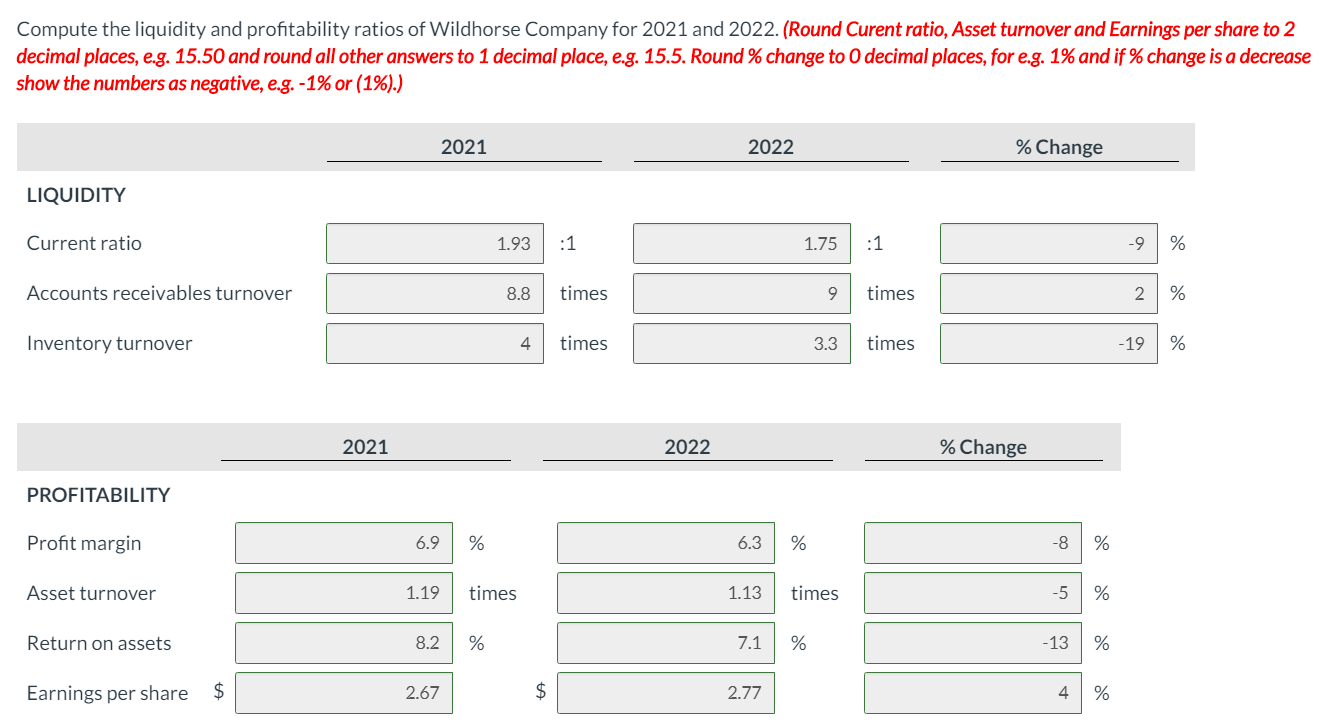
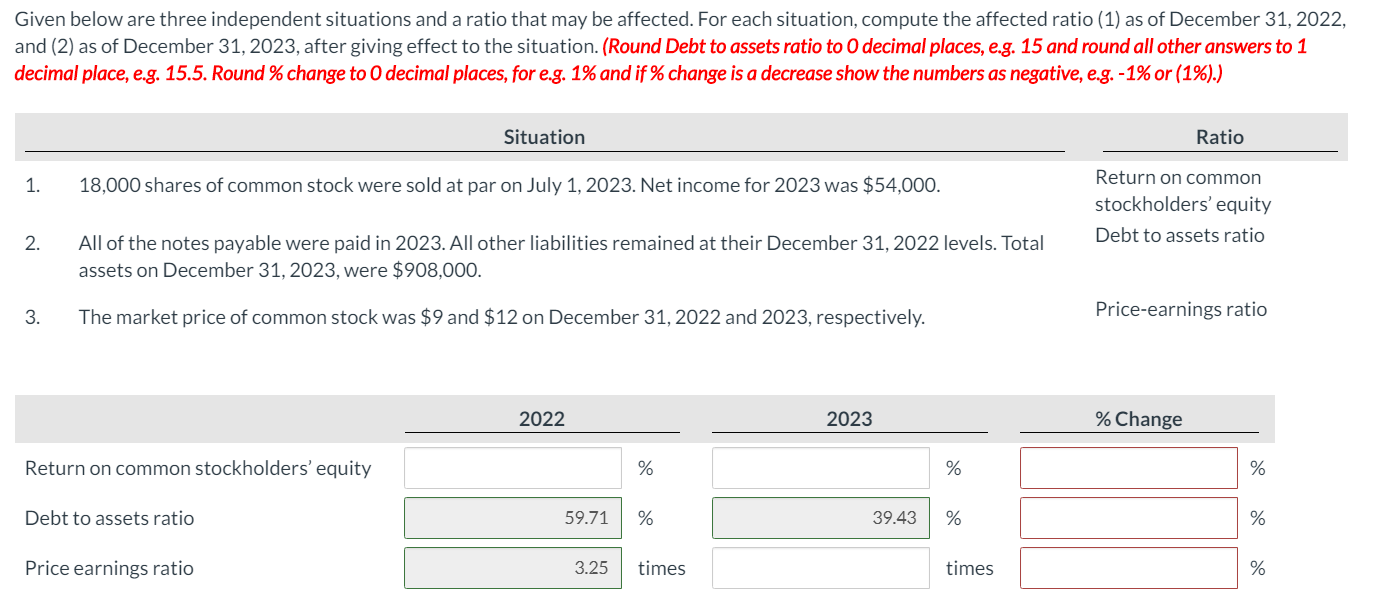
All parts in green are correct. The last section has 6 parts that are incorrect that need solving. WILDHORSE COMPANY Balance Sheets December 31 Assets
All parts in green are correct. The last section has 6 parts that are incorrect that need solving.
WILDHORSE COMPANY Balance Sheets December 31 Assets Cash Debt investments (short-term) Accounts receivable Inventory 2022 2021 $ 70,000 $68,000 51,000 40,000 109,000 91,000 231,000 167,000 27,000 26,000 134,000 134,000 264,000 186,000 $886,000 $712,000 Prepaid expenses Land Building and equipment (net) Total assets Liabilities and Stockholders' Equity Notes payable $171,000 $109,000 Accounts payable 67,000 53,000 Accrued liabilities 41,000 41,000 Bonds payable, due 2025 250,000 170,000 Common stock, $10 par 206,000 151,000 206,000 133,000 Retained earnings Total liabilities and stockholders' equity $886,000 $712,000 WILDHORSE COMPANY Income Statements For the Years Ended December 31 2022 2021 Sales revenue $899,000 $798,000 Cost of goods sold 650,000 575,000 Gross profit 249,000 223,000 Operating expenses 168,000 192,000 $ 57,000 Net income $ 55,000 Additional information: 1. Inventory at the beginning of 2021 was $117,000. 2. Accounts receivable (net) at the beginning of 2021 were $90,000. 3. Total assets at the beginning of 2021 were $634,000. 4. No common stock transactions occurred during 2021 or 2022. 5. All sales were on account. Compute the liquidity and profitability ratios of Wildhorse Company for 2021 and 2022. (Round Curent ratio, Asset turnover and Earnings per share to 2 decimal places, e.g. 15.50 and round all other answers to 1 decimal place, e.g. 15.5. Round % change to 0 decimal places, for e.g. 1% and if % change is a decrease show the numbers as negative, e.g. -1% or (1%).) 2021 2022 % Change LIQUIDITY Current ratio 1.93 :1 1.93 1 1.75 .75 :1 - Accounts receivables turnover 8.8 times times Inventory turnover times times 2021 2022 % Change PROFITABILITY Profit margin 6.9 6.3 Asset turnover 1.19 times 1.13 Return on assets 8.2 7.1 % -13 Earnings per share $ 2.67 2.77 4 Given below are three independent situations and a ratio that may be affected. For each situation, compute the affected ratio (1) as of December 31, 2022, and (2) as of December 31, 2023, after giving effect to the situation. (Round Debt to assets ratio to 0 decimal places, e.g. 15 and round all other answers to 1 decimal place, e.g. 15.5. Round % change to O decimal places, for e.g. 1% and if % change is a decrease show the numbers as negative, e.g. -1% or (1%).) Situation Ratio 1. 18,000 shares of common stock were sold at par on July 1, 2023. Net income for 2023 was $54,000. Return on common stockholders' equity Debt to assets ratio All of the notes payable were paid in 2023. All other liabilities remained at their December 31, 2022 levels. Total assets on December 31, 2023, were $908,000. 3. The market price of common stock was $9 and $12 on December 31, 2022 and 2023, respectively. Price-earnings ratio 2022 2023 % Change Return on common stockholders' equity Debt to assets ratio 59.71 39.43 Price earnings ratio 3.25 times times WILDHORSE COMPANY Balance Sheets December 31 Assets Cash Debt investments (short-term) Accounts receivable Inventory 2022 2021 $ 70,000 $68,000 51,000 40,000 109,000 91,000 231,000 167,000 27,000 26,000 134,000 134,000 264,000 186,000 $886,000 $712,000 Prepaid expenses Land Building and equipment (net) Total assets Liabilities and Stockholders' Equity Notes payable $171,000 $109,000 Accounts payable 67,000 53,000 Accrued liabilities 41,000 41,000 Bonds payable, due 2025 250,000 170,000 Common stock, $10 par 206,000 151,000 206,000 133,000 Retained earnings Total liabilities and stockholders' equity $886,000 $712,000 WILDHORSE COMPANY Income Statements For the Years Ended December 31 2022 2021 Sales revenue $899,000 $798,000 Cost of goods sold 650,000 575,000 Gross profit 249,000 223,000 Operating expenses 168,000 192,000 $ 57,000 Net income $ 55,000 Additional information: 1. Inventory at the beginning of 2021 was $117,000. 2. Accounts receivable (net) at the beginning of 2021 were $90,000. 3. Total assets at the beginning of 2021 were $634,000. 4. No common stock transactions occurred during 2021 or 2022. 5. All sales were on account. Compute the liquidity and profitability ratios of Wildhorse Company for 2021 and 2022. (Round Curent ratio, Asset turnover and Earnings per share to 2 decimal places, e.g. 15.50 and round all other answers to 1 decimal place, e.g. 15.5. Round % change to 0 decimal places, for e.g. 1% and if % change is a decrease show the numbers as negative, e.g. -1% or (1%).) 2021 2022 % Change LIQUIDITY Current ratio 1.93 :1 1.93 1 1.75 .75 :1 - Accounts receivables turnover 8.8 times times Inventory turnover times times 2021 2022 % Change PROFITABILITY Profit margin 6.9 6.3 Asset turnover 1.19 times 1.13 Return on assets 8.2 7.1 % -13 Earnings per share $ 2.67 2.77 4 Given below are three independent situations and a ratio that may be affected. For each situation, compute the affected ratio (1) as of December 31, 2022, and (2) as of December 31, 2023, after giving effect to the situation. (Round Debt to assets ratio to 0 decimal places, e.g. 15 and round all other answers to 1 decimal place, e.g. 15.5. Round % change to O decimal places, for e.g. 1% and if % change is a decrease show the numbers as negative, e.g. -1% or (1%).) Situation Ratio 1. 18,000 shares of common stock were sold at par on July 1, 2023. Net income for 2023 was $54,000. Return on common stockholders' equity Debt to assets ratio All of the notes payable were paid in 2023. All other liabilities remained at their December 31, 2022 levels. Total assets on December 31, 2023, were $908,000. 3. The market price of common stock was $9 and $12 on December 31, 2022 and 2023, respectively. Price-earnings ratio 2022 2023 % Change Return on common stockholders' equity Debt to assets ratio 59.71 39.43 Price earnings ratio 3.25 times timesStep by Step Solution
There are 3 Steps involved in it
Step: 1

Get Instant Access to Expert-Tailored Solutions
See step-by-step solutions with expert insights and AI powered tools for academic success
Step: 2

Step: 3
Ace Your Homework with AI
Get the answers you need in no time with our AI-driven, step-by-step assistance
Get Started
College Accounting
Authors: Heintz and Parry
20th Edition
1285892070, 538489669, 9781111790301, 978-1285892078, 9780538489669, 1111790302, 978-0538745192