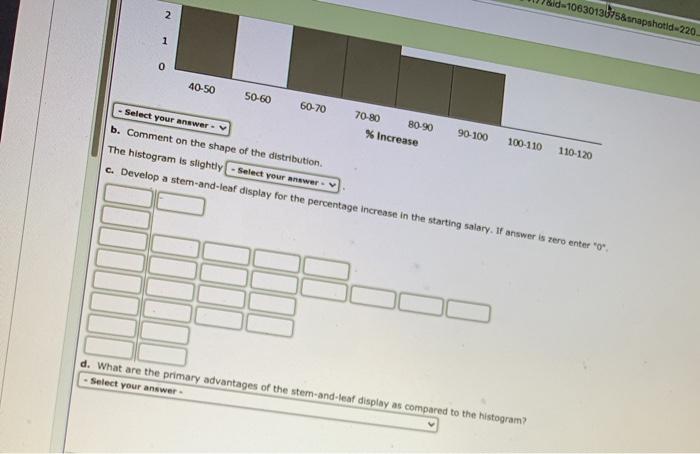
ALL PARTS LAST QUESTION CLEARLY LABELED
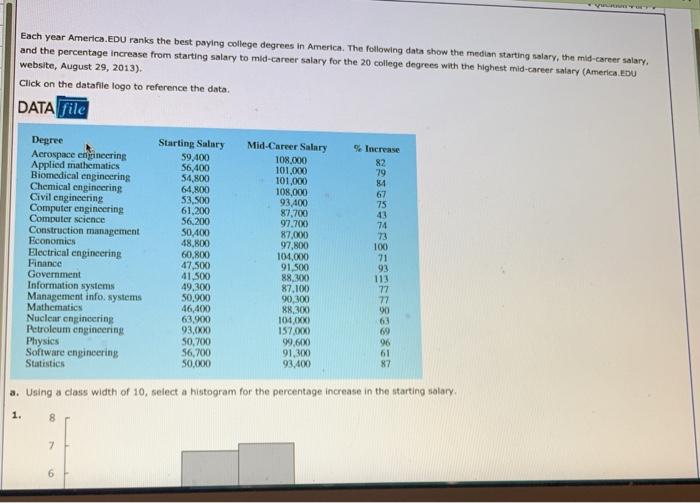
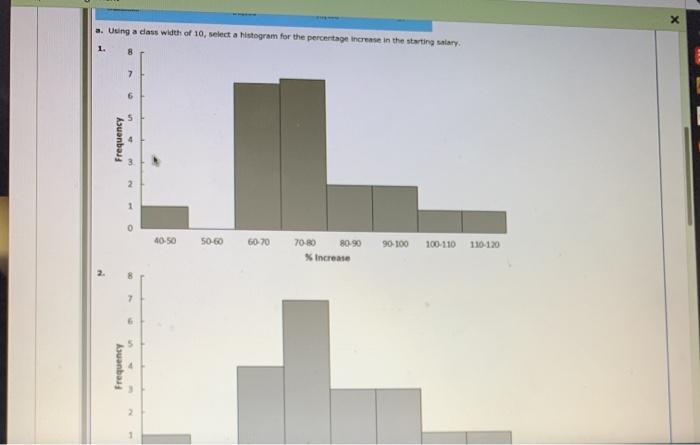
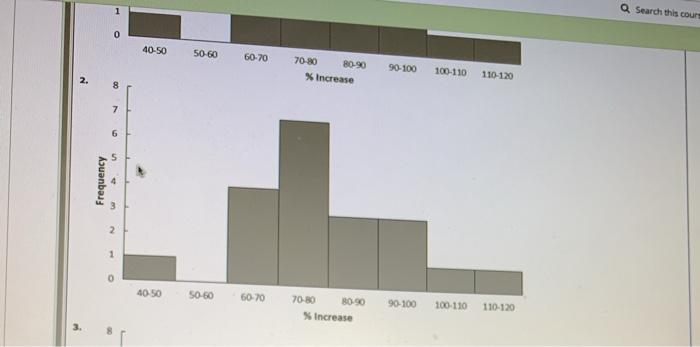
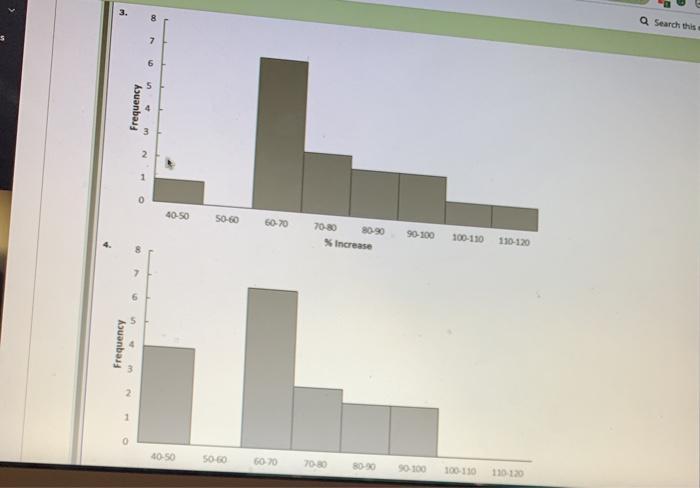
Each year America.EDU ranks the best paying college degrees in America. The following data show the median starting salary, the mid-career salary and the percentage increase from starting salary to mid-career salary for the 20 college degrees with the highest mid-career salary (America EDU website, August 29, 2013). Click on the datafile logo to reference the data. DATA file Degree Aerospace engineering Applied mathematics Biomedical engineering Chemical engineering Civil engineering Computer engineering Computer science Construction management Economics Electrical engineering Finance Government Information systems Management info. systems Mathematics Nucleur engineering Petroleum engineering Physics Software engineering Statistics Starting Salary 59.400 56,400 54,800 64,800 53.500 61,200 56.200 50.400 48,800 60,800 47,500 41.500 49,300 50,900 46,400 63.900 93,000 50,700 56,700 50,000 Mid-Career Salary 108.000 101.000 101,000 108,000 93400 87,700 97.700 87.000 97.800 104,000 91,500 88.300) 87.100 90,300 88,300 104.0XX) 157.000 99,600 91,300 93.400 % Increase 82 79 84 67 75 43 74 73 100 71 93 113 77 77 63 69 96 61 87 a. Using a class width of 10, select a histogram for the percentage increase in the starting salary 1. 8 7 6 Using a class width of 10, select a Histogram for the percentage creme in the starting wiary. 8 7 6 Frequency 2 1 0 40-50 50-60 60-70 90-100 100-110 110-120 70-80 80.90 % Increase 7 6 5 Frequency Q Search this cours 40-50 50-60 60-70 70-80 80-90 X Increase 90-100 100-110 110-120 3 7 6 Frequency 2 40-50 50-60 60-70 70-80 80-90 Increase 90-100 100-110 110-120 3 1 Q Search this 10 Frequency 2 0 4050 15060 070 17080 8090 Increase 90-100 100-150 150120 17 6 Frequency 2 1 0 400 5000 16070 17080 150-100 100110 110 120 ad-1063013075&snapshotid 220 2 1 0 40-50 50-60 60-70 70-80 80-90 90-100 100-110 110-120 % Increase Select your answer b. Comment on the shape of the distribution The histogram is slightly Select your answer c. Develop a stem-and-leaf display for the percentage increase in the starting salary. If answer is zero enter ** d. What are the primary advantages of the stem-and-teat display as compared to the histogram? Select your answer Each year America.EDU ranks the best paying college degrees in America. The following data show the median starting salary, the mid-career salary and the percentage increase from starting salary to mid-career salary for the 20 college degrees with the highest mid-career salary (America EDU website, August 29, 2013). Click on the datafile logo to reference the data. DATA file Degree Aerospace engineering Applied mathematics Biomedical engineering Chemical engineering Civil engineering Computer engineering Computer science Construction management Economics Electrical engineering Finance Government Information systems Management info. systems Mathematics Nucleur engineering Petroleum engineering Physics Software engineering Statistics Starting Salary 59.400 56,400 54,800 64,800 53.500 61,200 56.200 50.400 48,800 60,800 47,500 41.500 49,300 50,900 46,400 63.900 93,000 50,700 56,700 50,000 Mid-Career Salary 108.000 101.000 101,000 108,000 93400 87,700 97.700 87.000 97.800 104,000 91,500 88.300) 87.100 90,300 88,300 104.0XX) 157.000 99,600 91,300 93.400 % Increase 82 79 84 67 75 43 74 73 100 71 93 113 77 77 63 69 96 61 87 a. Using a class width of 10, select a histogram for the percentage increase in the starting salary 1. 8 7 6 Using a class width of 10, select a Histogram for the percentage creme in the starting wiary. 8 7 6 Frequency 2 1 0 40-50 50-60 60-70 90-100 100-110 110-120 70-80 80.90 % Increase 7 6 5 Frequency Q Search this cours 40-50 50-60 60-70 70-80 80-90 X Increase 90-100 100-110 110-120 3 7 6 Frequency 2 40-50 50-60 60-70 70-80 80-90 Increase 90-100 100-110 110-120 3 1 Q Search this 10 Frequency 2 0 4050 15060 070 17080 8090 Increase 90-100 100-150 150120 17 6 Frequency 2 1 0 400 5000 16070 17080 150-100 100110 110 120 ad-1063013075&snapshotid 220 2 1 0 40-50 50-60 60-70 70-80 80-90 90-100 100-110 110-120 % Increase Select your answer b. Comment on the shape of the distribution The histogram is slightly Select your answer c. Develop a stem-and-leaf display for the percentage increase in the starting salary. If answer is zero enter ** d. What are the primary advantages of the stem-and-teat display as compared to the histogram? Select your