

Answered step by step
Verified Expert Solution
Question
1 Approved Answer
all parts of five please its closer thank you Roteine ever the number of violentrimes in the United States for the year 1984 to 1991
all parts of five please 
its closer thank you 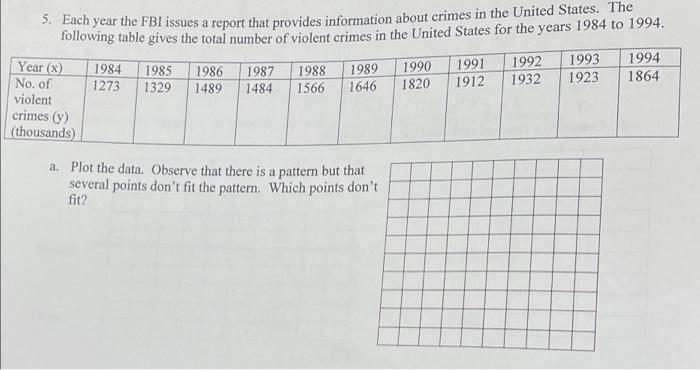

Roteine ever the number of violentrimes in the United States for the year 1984 to 1991 Each year the report that made information about crimes in the United States. The YASI 194 TO 10 TORE 1989 1990 1901 1991 Nor 1273 1120 1489 14 1566 1646 1920 1994 1902 violent 1933 14 cintes) thousand 1912 . Plot the data. Observe that there is a pattern but that several points don't fit the pattern. Which points don't Are violent crimes increasing linearly or exponentially? Calculate the ratios (data for year1/data for year n) and note them in the table. Are the ratios approximately constant and greater than 17 What is the average ratio for the first eight data points? b. You decide to discard the last three points and develop and exponential model for the year 1984 10 1991. Delete these points and transform the remaining data to achieve a linear scanerplot. Put the years (x) and the transformed values for y in the table below. Year c. Plot the transformed data and the residual plot for the transformed plot. Perform a least squares regression on the transformed points and record the correlation coefficient, coefficient of determination and LSRL. d. Perform the inverse transformation and record the cquation that model the data for the years 1994 to 1991 e. Use the exponential model from part d to predict the number of violent crimes in 1986. 5. Each year the FBI issues a report that provides information about crimes in the United States. The following table gives the total number of violent crimes in the United States for the years 1984 to 1994. 1994 1991 1985 1992 1993 Year (x) No. of 1990 1984 1273 1986 1987 1988 1989 1329 1489 1484 1566 1646 1820 1912 1932 1923 1864 violent crimes (y) (thousands) a. Plot the data. Observe that there is a pattern but that several points don't fit the pattern. Which points don't fit? b. Are violent crimes increasing linearly or exponentially? Calculate the ratios (data for year n+1/data for year n) and note them in the first eight data pois approximately constant and greater than 1? What average ratio for points? b. You decide to discard the last three points and develop and exponential model for the years 1984 to 1991. Delete these points and transform the remaining data to achieve a linear scatterplot. Put the years (x) and the transformed values for y in the table below. Year c. Plot the transformed data and the residual plot for the transformed plot. Perform a least squares regression on the transformed points and record the correlation coefficient, coefficient of determination and LSRL. d. Perform the inverse transformation and record the equation that model the data for the years 1994 to 1991. e. Use the exponential model from part d to predict the number of violent crimes in 1986. u Roteine ever the number of violentrimes in the United States for the year 1984 to 1991 Each year the report that made information about crimes in the United States. The YASI 194 TO 10 TORE 1989 1990 1901 1991 Nor 1273 1120 1489 14 1566 1646 1920 1994 1902 violent 1933 14 cintes) thousand 1912 . Plot the data. Observe that there is a pattern but that several points don't fit the pattern. Which points don't Are violent crimes increasing linearly or exponentially? Calculate the ratios (data for year1/data for year n) and note them in the table. Are the ratios approximately constant and greater than 17 What is the average ratio for the first eight data points? b. You decide to discard the last three points and develop and exponential model for the year 1984 10 1991. Delete these points and transform the remaining data to achieve a linear scanerplot. Put the years (x) and the transformed values for y in the table below. Year c. Plot the transformed data and the residual plot for the transformed plot. Perform a least squares regression on the transformed points and record the correlation coefficient, coefficient of determination and LSRL. d. Perform the inverse transformation and record the cquation that model the data for the years 1994 to 1991 e. Use the exponential model from part d to predict the number of violent crimes in 1986. 5. Each year the FBI issues a report that provides information about crimes in the United States. The following table gives the total number of violent crimes in the United States for the years 1984 to 1994. 1994 1991 1985 1992 1993 Year (x) No. of 1990 1984 1273 1986 1987 1988 1989 1329 1489 1484 1566 1646 1820 1912 1932 1923 1864 violent crimes (y) (thousands) a. Plot the data. Observe that there is a pattern but that several points don't fit the pattern. Which points don't fit? b. Are violent crimes increasing linearly or exponentially? Calculate the ratios (data for year n+1/data for year n) and note them in the first eight data pois approximately constant and greater than 1? What average ratio for points? b. You decide to discard the last three points and develop and exponential model for the years 1984 to 1991. Delete these points and transform the remaining data to achieve a linear scatterplot. Put the years (x) and the transformed values for y in the table below. Year c. Plot the transformed data and the residual plot for the transformed plot. Perform a least squares regression on the transformed points and record the correlation coefficient, coefficient of determination and LSRL. d. Perform the inverse transformation and record the equation that model the data for the years 1994 to 1991. e. Use the exponential model from part d to predict the number of violent crimes in 1986. u Step by Step Solution
There are 3 Steps involved in it
Step: 1

Get Instant Access to Expert-Tailored Solutions
See step-by-step solutions with expert insights and AI powered tools for academic success
Step: 2

Step: 3
Ace Your Homework with AI
Get the answers you need in no time with our AI-driven, step-by-step assistance
Get Started
Crypto Asset Investing In The Age Of Autonomy
Authors: Jake Ryan
1st Edition
1119705363, 978-1119705369