All questions answered with explanations, handwritten.
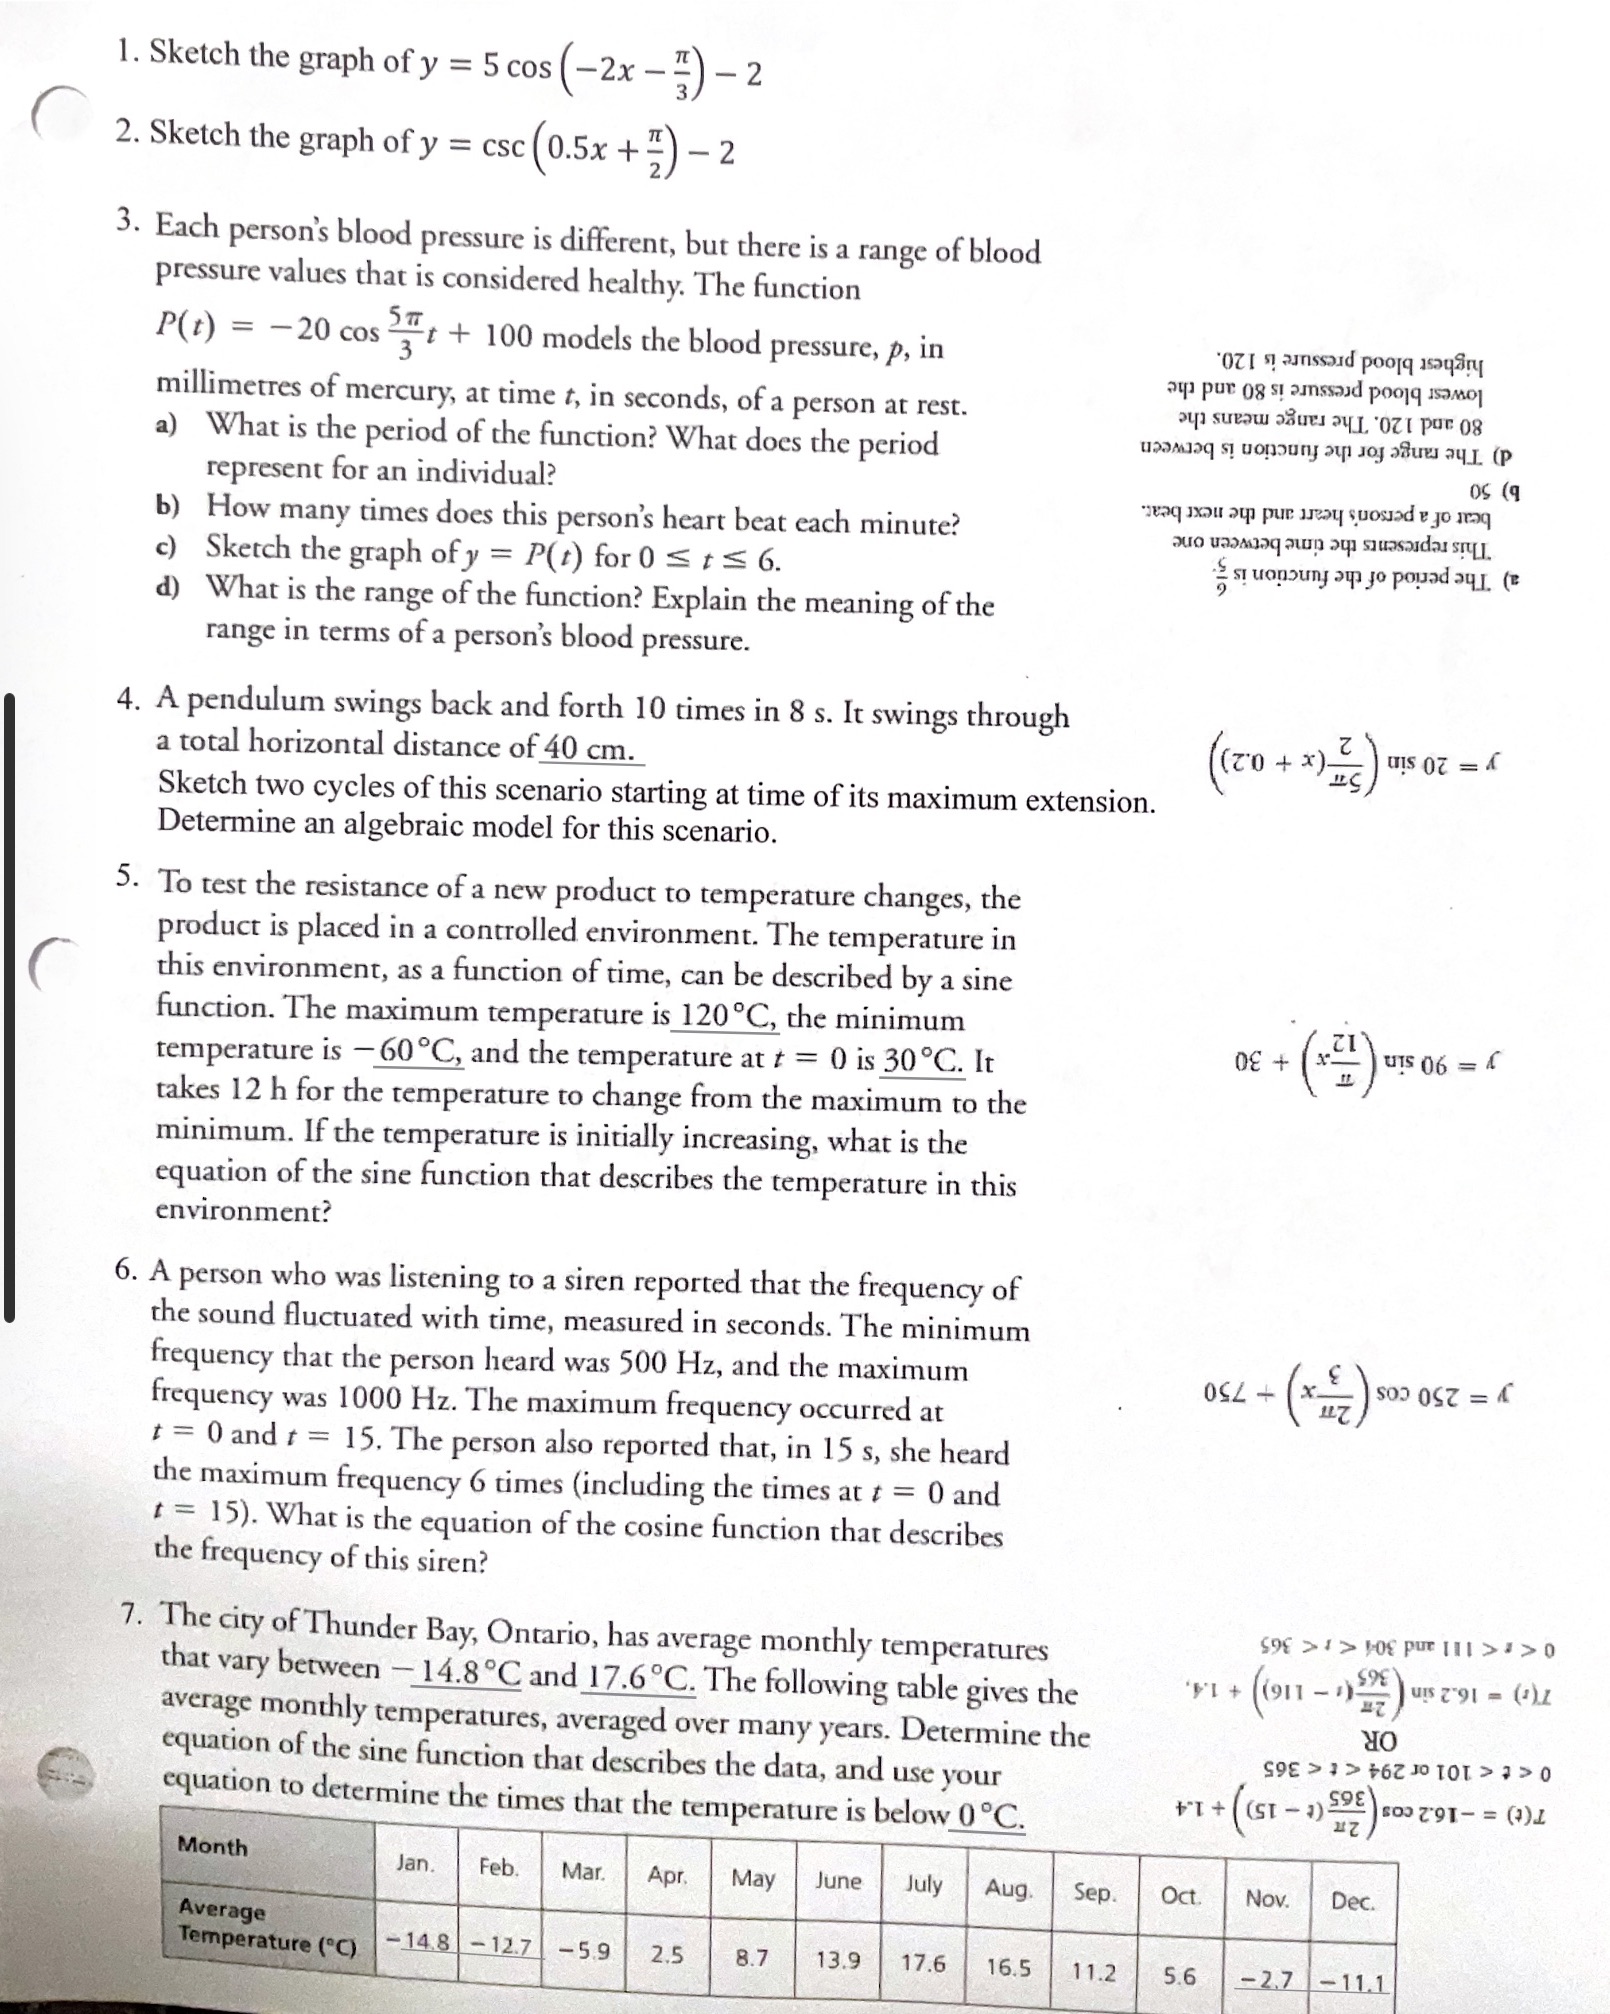
1. Sketch the graph of y = 5 cos (-2x - ") - 2 2. Sketch the graph of y = csc (0.5x + ") - 2 3. Each person's blood pressure is different, but there is a range of blood pressure values that is considered healthy. The function P(t) = -20 cost + 100 models the blood pressure, p, in highest blood pressure is 120. lowest blood pressure is 80 and the millimetres of mercury, at time t, in seconds, of a person at rest. 80 and 120. The range means the a) What is the period of the function? What does the period d) The range for the function is between represent for an individual? OS (9 b) How many times does this person's heart beat each minute? beat of a person's heart and the next beat This represents the time between one c) Sketch the graph of y = P(t) for 0 S t - 6. a) The period of the function is 5. d) What is the range of the function? Explain the meaning of the range in terms of a person's blood pressure. 4. A pendulum swings back and forth 10 times in 8 s. It swings through a total horizontal distance of 40 cm. ((20 + * ) 2 ) 015 07 =1 Sketch two cycles of this scenario starting at time of its maximum extension. Determine an algebraic model for this scenario. 5. To test the resistance of a new product to temperature changes, the product is placed in a controlled environment. The temperature in this environment, as a function of time, can be described by a sine function. The maximum temperature is 120 C, the minimum temperature is -60 C, and the temperature at t = 0 is 30 C. It y = 90 sin ( + 30 takes 12 h for the temperature to change from the maximum to the minimum. If the temperature is initially increasing, what is the equation of the sine function that describes the temperature in this environment? 6. A person who was listening to a siren reported that the frequency of the sound fluctuated with time, measured in seconds. The minimum frequency that the person heard was 500 Hz, and the maximum y = 250 cos x+ 750 frequency was 1000 Hz. The maximum frequency occurred at t = 0 and t = 15. The person also reported that, in 15 s, she heard the maximum frequency 6 times (including the times at z = 0 and 1 = 15). What is the equation of the cosine function that describes the frequency of this siren? 7. The city of Thunder Bay, Ontario, has average monthly temperatures $98 > > 108 put 1 1 1 > > 0 that vary between -14.8 C and 17.6 C. The following table gives the FI + (911 -1) _2) T(:) = 16.2 sin ( 365 average monthly temperatures, averaged over many years. Determine the OR equation of the sine function that describes the data, and use your Oct