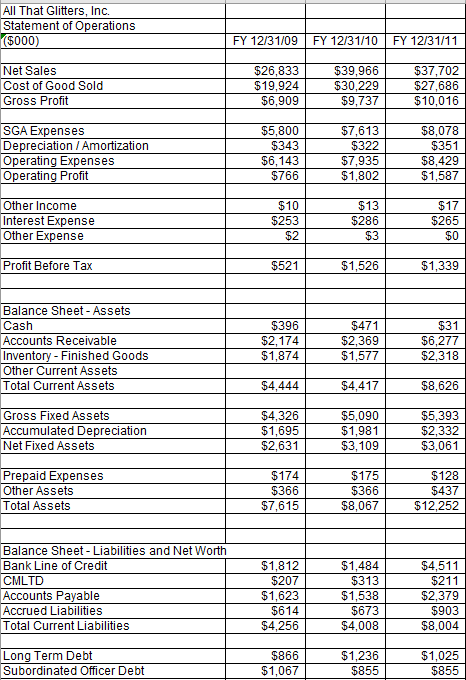
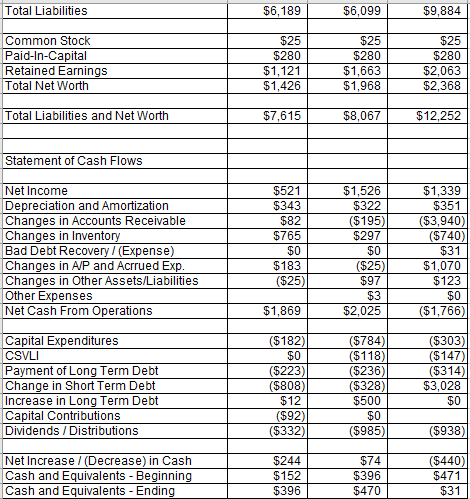
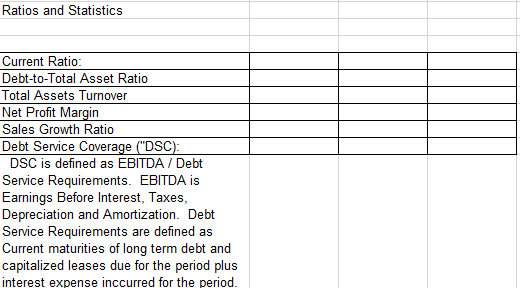
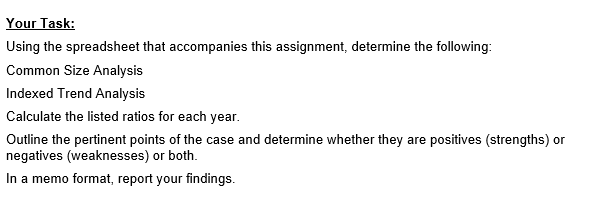
All That Glitters, Inc. Statement of Operations ($000) FY 12/31/09 FY 12/31/10 FY 12/31/11 Net Sales Cost of Good Sold Gross Profit $26,833 $19,924 $6,909 $39,966 $30,229 $9,737 $37,702 $27,686 $10,016 SGA Expenses Depreciation / Amortization Operating Expenses Operating Profit $5,800 $343 $6,143 $766 $7,613 $322 $7,935 $1,802 $8,078 $351 $8,429 $1,587 Other Income Interest Expense Other Expense $10 $253 $2 $13 $286 $3 $17 $265 $0 Profit Before Tax $521 $1,526 $1,339 Balance Sheet - Assets Cash Accounts Receivable Inventory - Finished Goods Other Current Assets Total Current Assets $396 $2,174 $1,874 $471 $2,369 $1,577 $31 $6,277 $2,318 $4,444 $4,417 $8,626 Gross Fixed Assets Accumulated Depreciation Net Fixed Assets $4,326 $1,695 $2,631 $5,090 $1,981 $3,109 $5,393 $2,332 $3,061 Prepaid Expenses Other Assets Total Assets $174 $366 $7,615 $175 $366 $8,067 $128 $437 $12,252 Balance Sheet - Liabilities and Net Worth Bank Line of Credit CMLTD Accounts Payable Accrued Liabilities Total Current Liabilities $1,812 $207 $1,623 $614 $4,256 $1,484 $313 $1,538 $673 $4,008 $4,511 $211 $2,379 $903 $8,004 Long Term Debt Subordinated Officer Debt $866 $1,067 $1,236 $855 $1,025 $855 Total Liabilities $6,189 $6,099 $9,884 Common Stock Paid-In-Capital Retained Earnings Total Net Worth $25 $280 $1,121 $1,426 $25 $280 $1,663 $1,968 $25 $280 $2,063 $2,368 Total Liabilities and Net Worth $7,615 $8,067 $12,252 Statement of Cash Flows Net Income Depreciation and Amortization Changes in Accounts Receivable Changes in Inventory Bad Debt Recovery / (Expense) Changes in A/P and Acrrued Exp. Changes in Other Assets/Liabilities Other Expenses Net Cash From Operations $521 $343 $82 $765 $0 $183 ($25) $1,526 $322 ($195) $297 $0 ($25) $97 $3 $2,025 $1,339 $351 ($3,940) ($740) $31 $1,070 $123 $0 ($1,766) $1,869 Capital Expenditures CSVLI Payment of Long Term Debt Change in Short Term Debt Increase in Long Term Debt Capital Contributions Dividends / Distributions ($182) $0 ($223) ($808) $12 ($92) ($332) ($784) ($118) ($236) ($328) $500 $0 ($985) ($303) ($147) ($314) $3,028 $0 ($938) Net Increase/(Decrease) in Cash Cash and Equivalents - Beginning Cash and Equivalents - Ending $244 $152 $396 $74 $396 $470 ($440) $471 $31 Ratios and Statistics Current Ratio: Debt-to-Total Asset Ratio Total Assets Turnover Net Profit Margin Sales Growth Ratio Debt Service Coverage ("DSC): DSC is defined as EBITDA / Debt Service Requirements. EBITDA is Earnings Before Interest, Taxes, Depreciation and Amortization. Debt Service Requirements are defined as Current maturities of long term debt and capitalized leases due for the period plus interest expense inccurred for the period. Your Task: Using the spreadsheet that accompanies this assignment, determine the following: Common Size Analysis Indexed Trend Analysis Calculate the listed ratios for each year. Outline the pertinent points of the case and determine whether they are positives (strengths) or negatives (weaknesses) or both. In a memo format, report your findings. All That Glitters, Inc. Statement of Operations ($000) FY 12/31/09 FY 12/31/10 FY 12/31/11 Net Sales Cost of Good Sold Gross Profit $26,833 $19,924 $6,909 $39,966 $30,229 $9,737 $37,702 $27,686 $10,016 SGA Expenses Depreciation / Amortization Operating Expenses Operating Profit $5,800 $343 $6,143 $766 $7,613 $322 $7,935 $1,802 $8,078 $351 $8,429 $1,587 Other Income Interest Expense Other Expense $10 $253 $2 $13 $286 $3 $17 $265 $0 Profit Before Tax $521 $1,526 $1,339 Balance Sheet - Assets Cash Accounts Receivable Inventory - Finished Goods Other Current Assets Total Current Assets $396 $2,174 $1,874 $471 $2,369 $1,577 $31 $6,277 $2,318 $4,444 $4,417 $8,626 Gross Fixed Assets Accumulated Depreciation Net Fixed Assets $4,326 $1,695 $2,631 $5,090 $1,981 $3,109 $5,393 $2,332 $3,061 Prepaid Expenses Other Assets Total Assets $174 $366 $7,615 $175 $366 $8,067 $128 $437 $12,252 Balance Sheet - Liabilities and Net Worth Bank Line of Credit CMLTD Accounts Payable Accrued Liabilities Total Current Liabilities $1,812 $207 $1,623 $614 $4,256 $1,484 $313 $1,538 $673 $4,008 $4,511 $211 $2,379 $903 $8,004 Long Term Debt Subordinated Officer Debt $866 $1,067 $1,236 $855 $1,025 $855 Total Liabilities $6,189 $6,099 $9,884 Common Stock Paid-In-Capital Retained Earnings Total Net Worth $25 $280 $1,121 $1,426 $25 $280 $1,663 $1,968 $25 $280 $2,063 $2,368 Total Liabilities and Net Worth $7,615 $8,067 $12,252 Statement of Cash Flows Net Income Depreciation and Amortization Changes in Accounts Receivable Changes in Inventory Bad Debt Recovery / (Expense) Changes in A/P and Acrrued Exp. Changes in Other Assets/Liabilities Other Expenses Net Cash From Operations $521 $343 $82 $765 $0 $183 ($25) $1,526 $322 ($195) $297 $0 ($25) $97 $3 $2,025 $1,339 $351 ($3,940) ($740) $31 $1,070 $123 $0 ($1,766) $1,869 Capital Expenditures CSVLI Payment of Long Term Debt Change in Short Term Debt Increase in Long Term Debt Capital Contributions Dividends / Distributions ($182) $0 ($223) ($808) $12 ($92) ($332) ($784) ($118) ($236) ($328) $500 $0 ($985) ($303) ($147) ($314) $3,028 $0 ($938) Net Increase/(Decrease) in Cash Cash and Equivalents - Beginning Cash and Equivalents - Ending $244 $152 $396 $74 $396 $470 ($440) $471 $31 Ratios and Statistics Current Ratio: Debt-to-Total Asset Ratio Total Assets Turnover Net Profit Margin Sales Growth Ratio Debt Service Coverage ("DSC): DSC is defined as EBITDA / Debt Service Requirements. EBITDA is Earnings Before Interest, Taxes, Depreciation and Amortization. Debt Service Requirements are defined as Current maturities of long term debt and capitalized leases due for the period plus interest expense inccurred for the period. Your Task: Using the spreadsheet that accompanies this assignment, determine the following: Common Size Analysis Indexed Trend Analysis Calculate the listed ratios for each year. Outline the pertinent points of the case and determine whether they are positives (strengths) or negatives (weaknesses) or both. In a memo format, report your findings