Answered step by step
Verified Expert Solution
Link Copied!

Question

1 Approved Answer

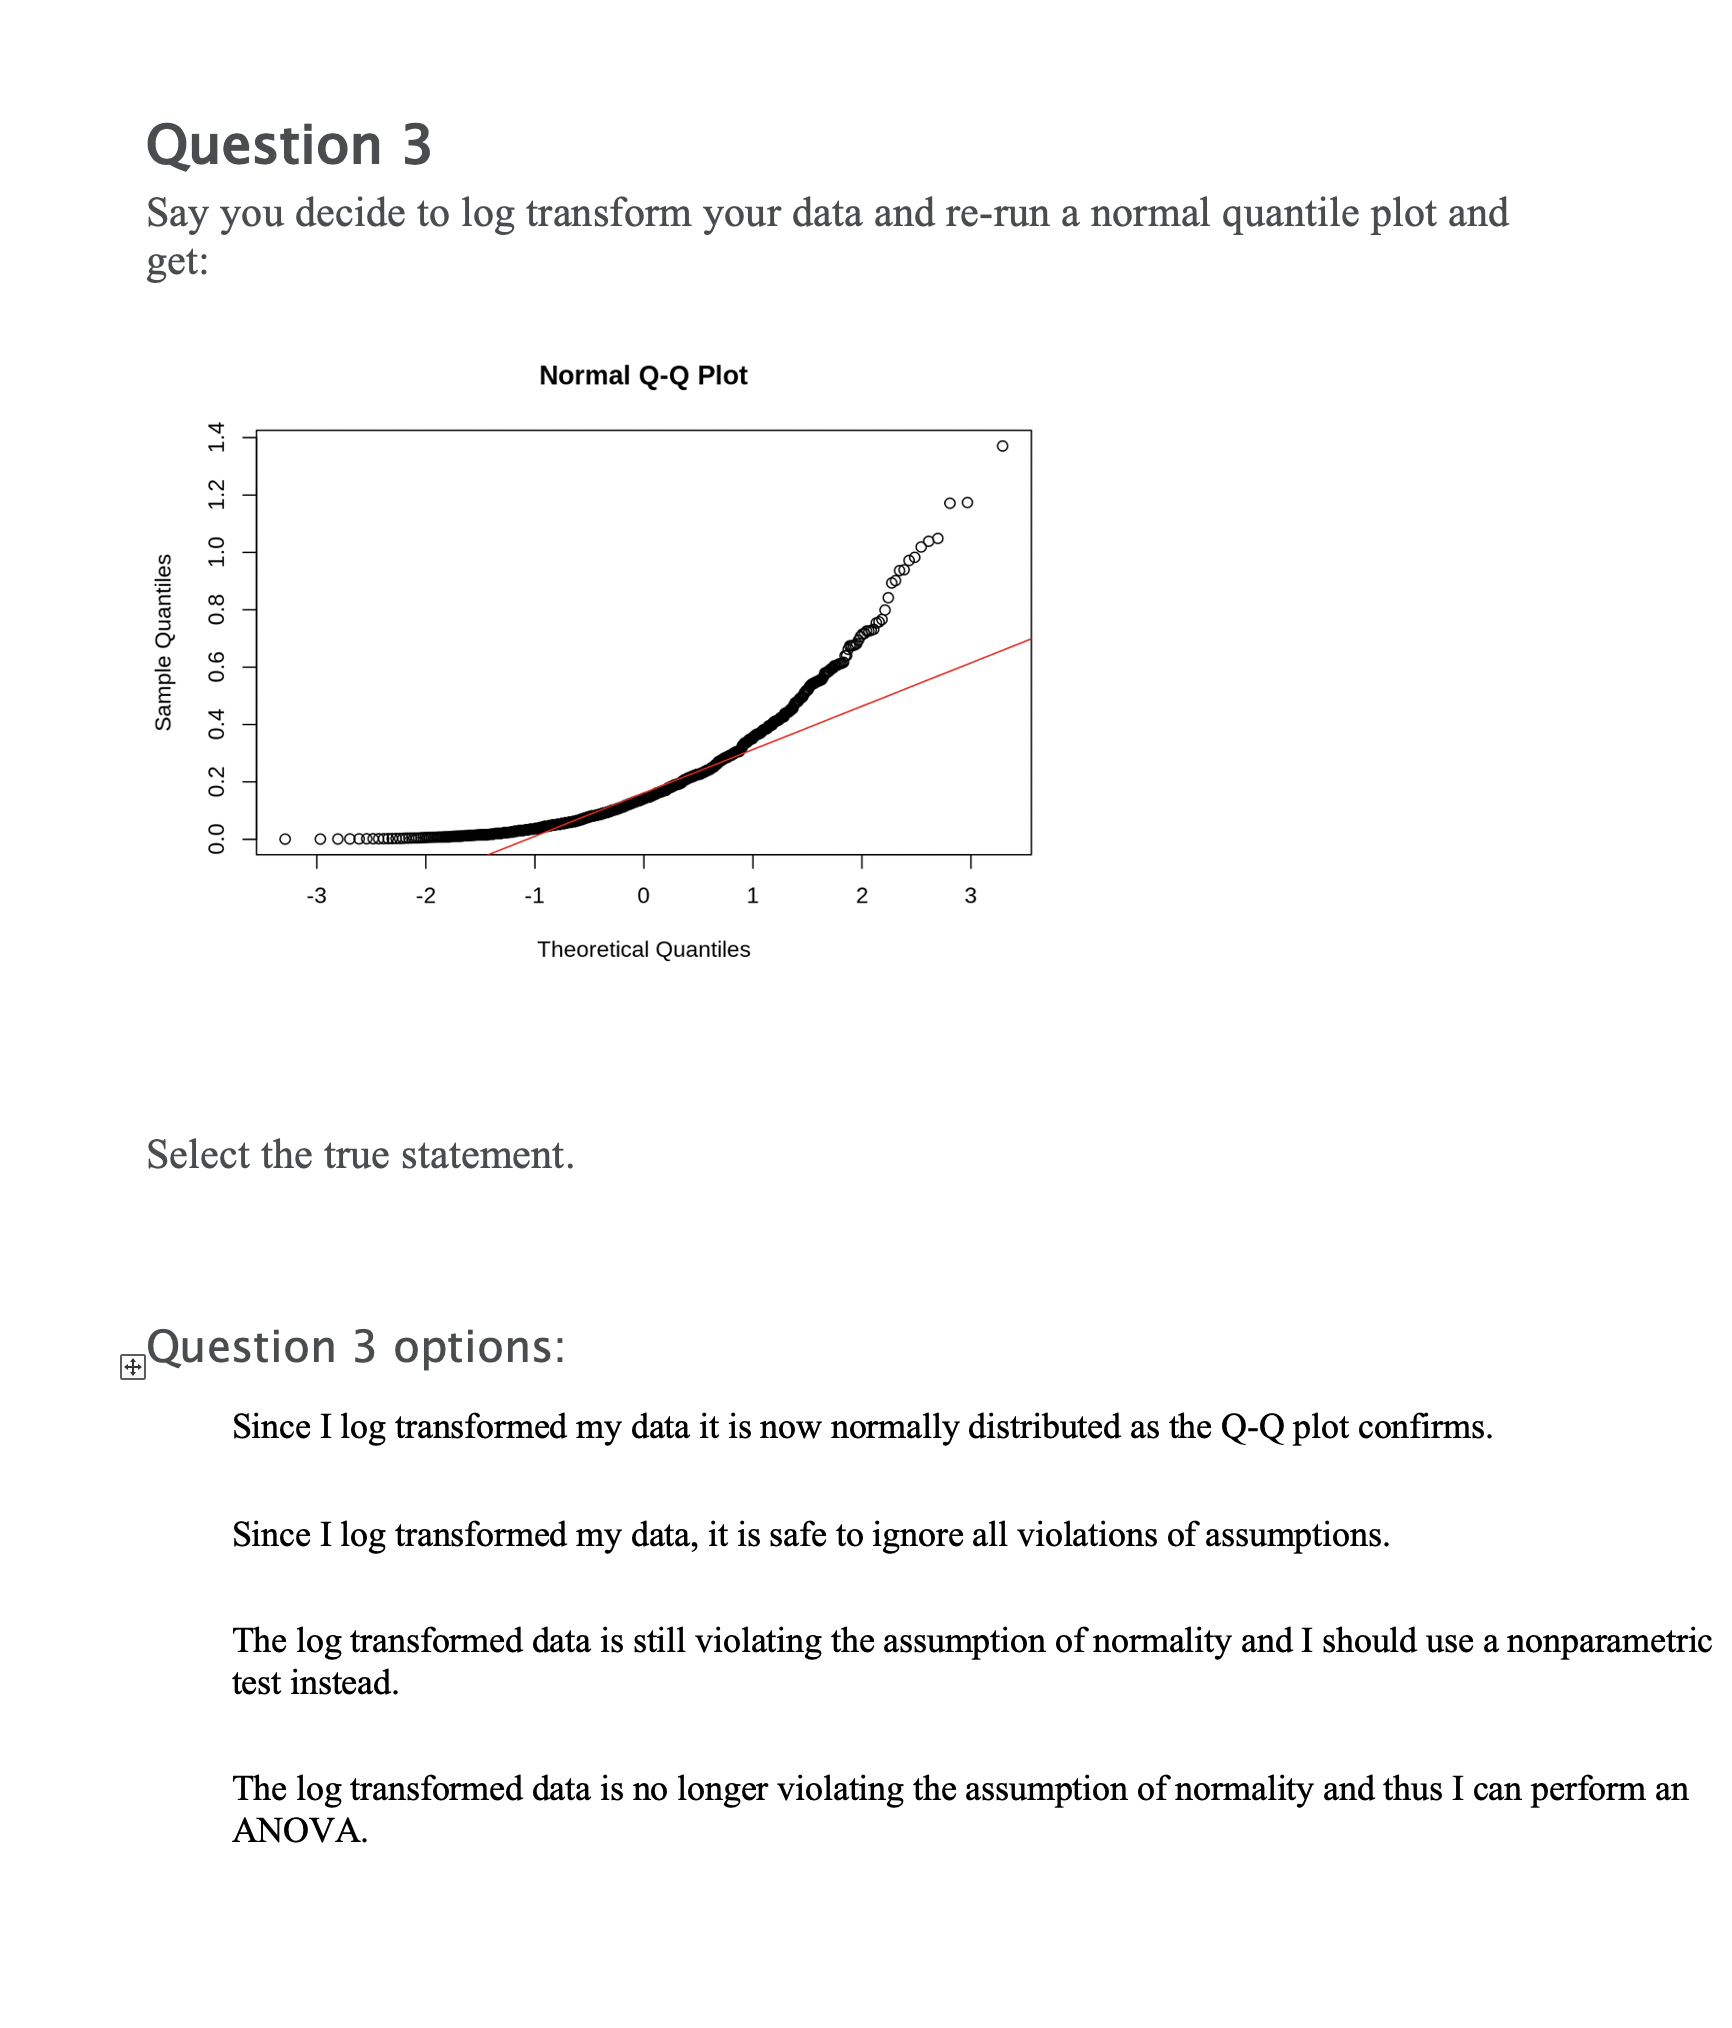
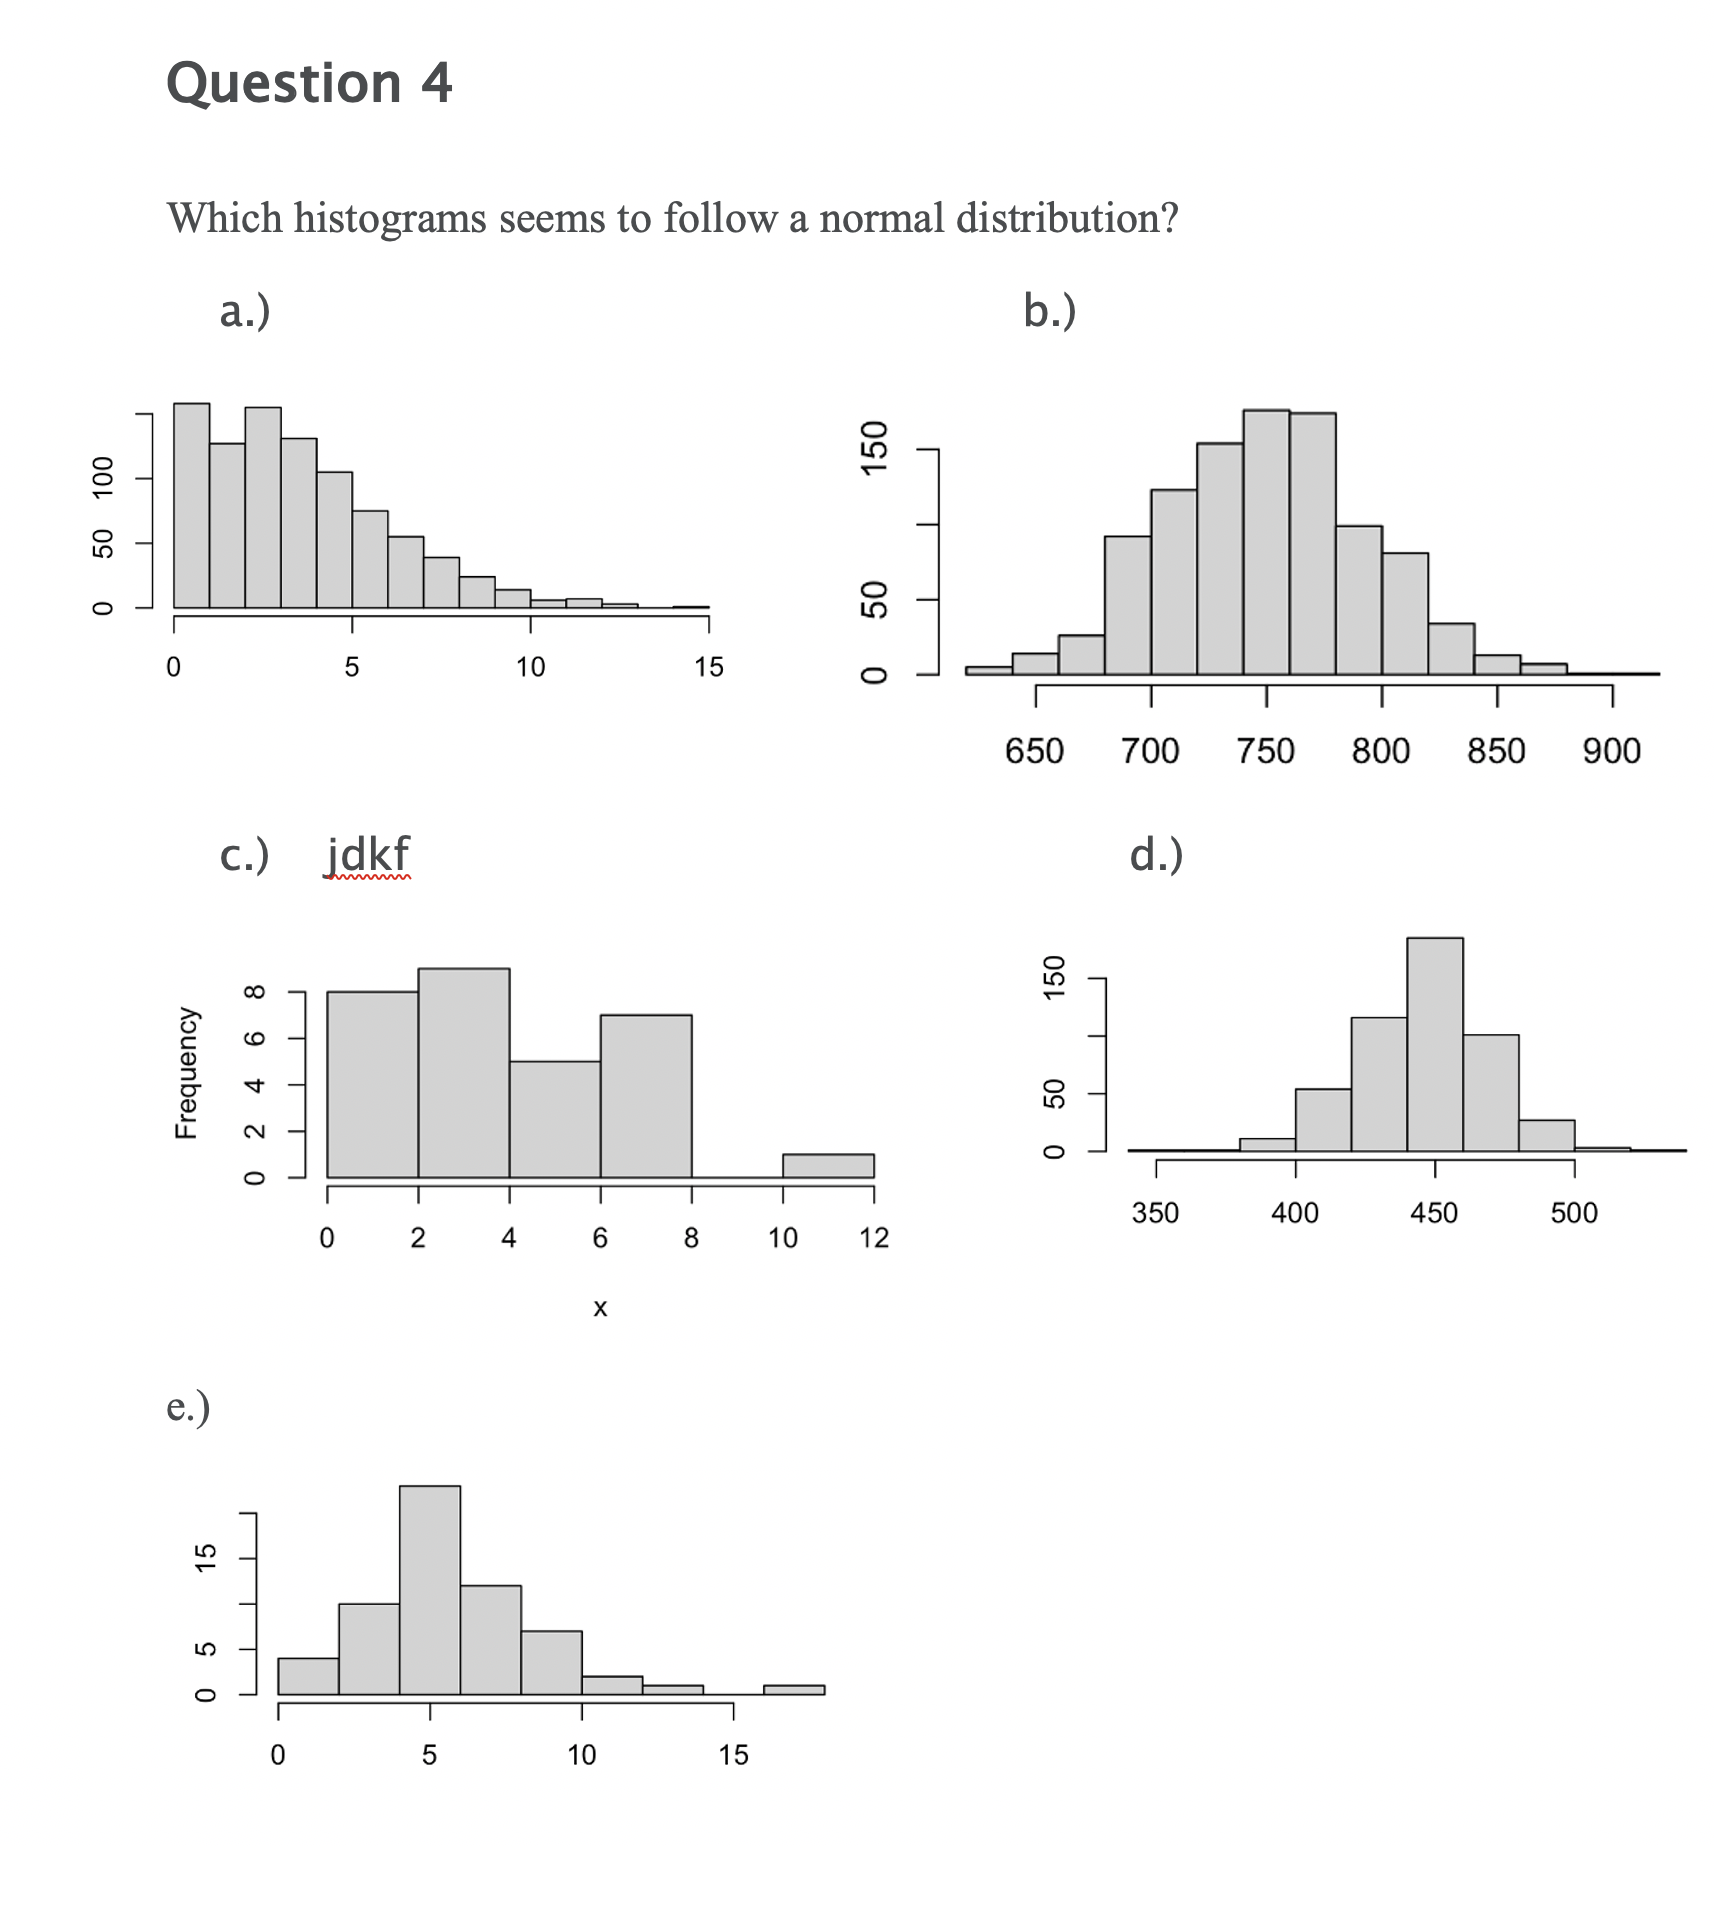
ALL THE FIGURES ARE UPLOADED Question 1: Say you are a marine biologist intere Say you are a marine biologist interested in studying the effects

ALL THE FIGURES ARE UPLOADED

Question 1:

Say you are a marine biologist intere
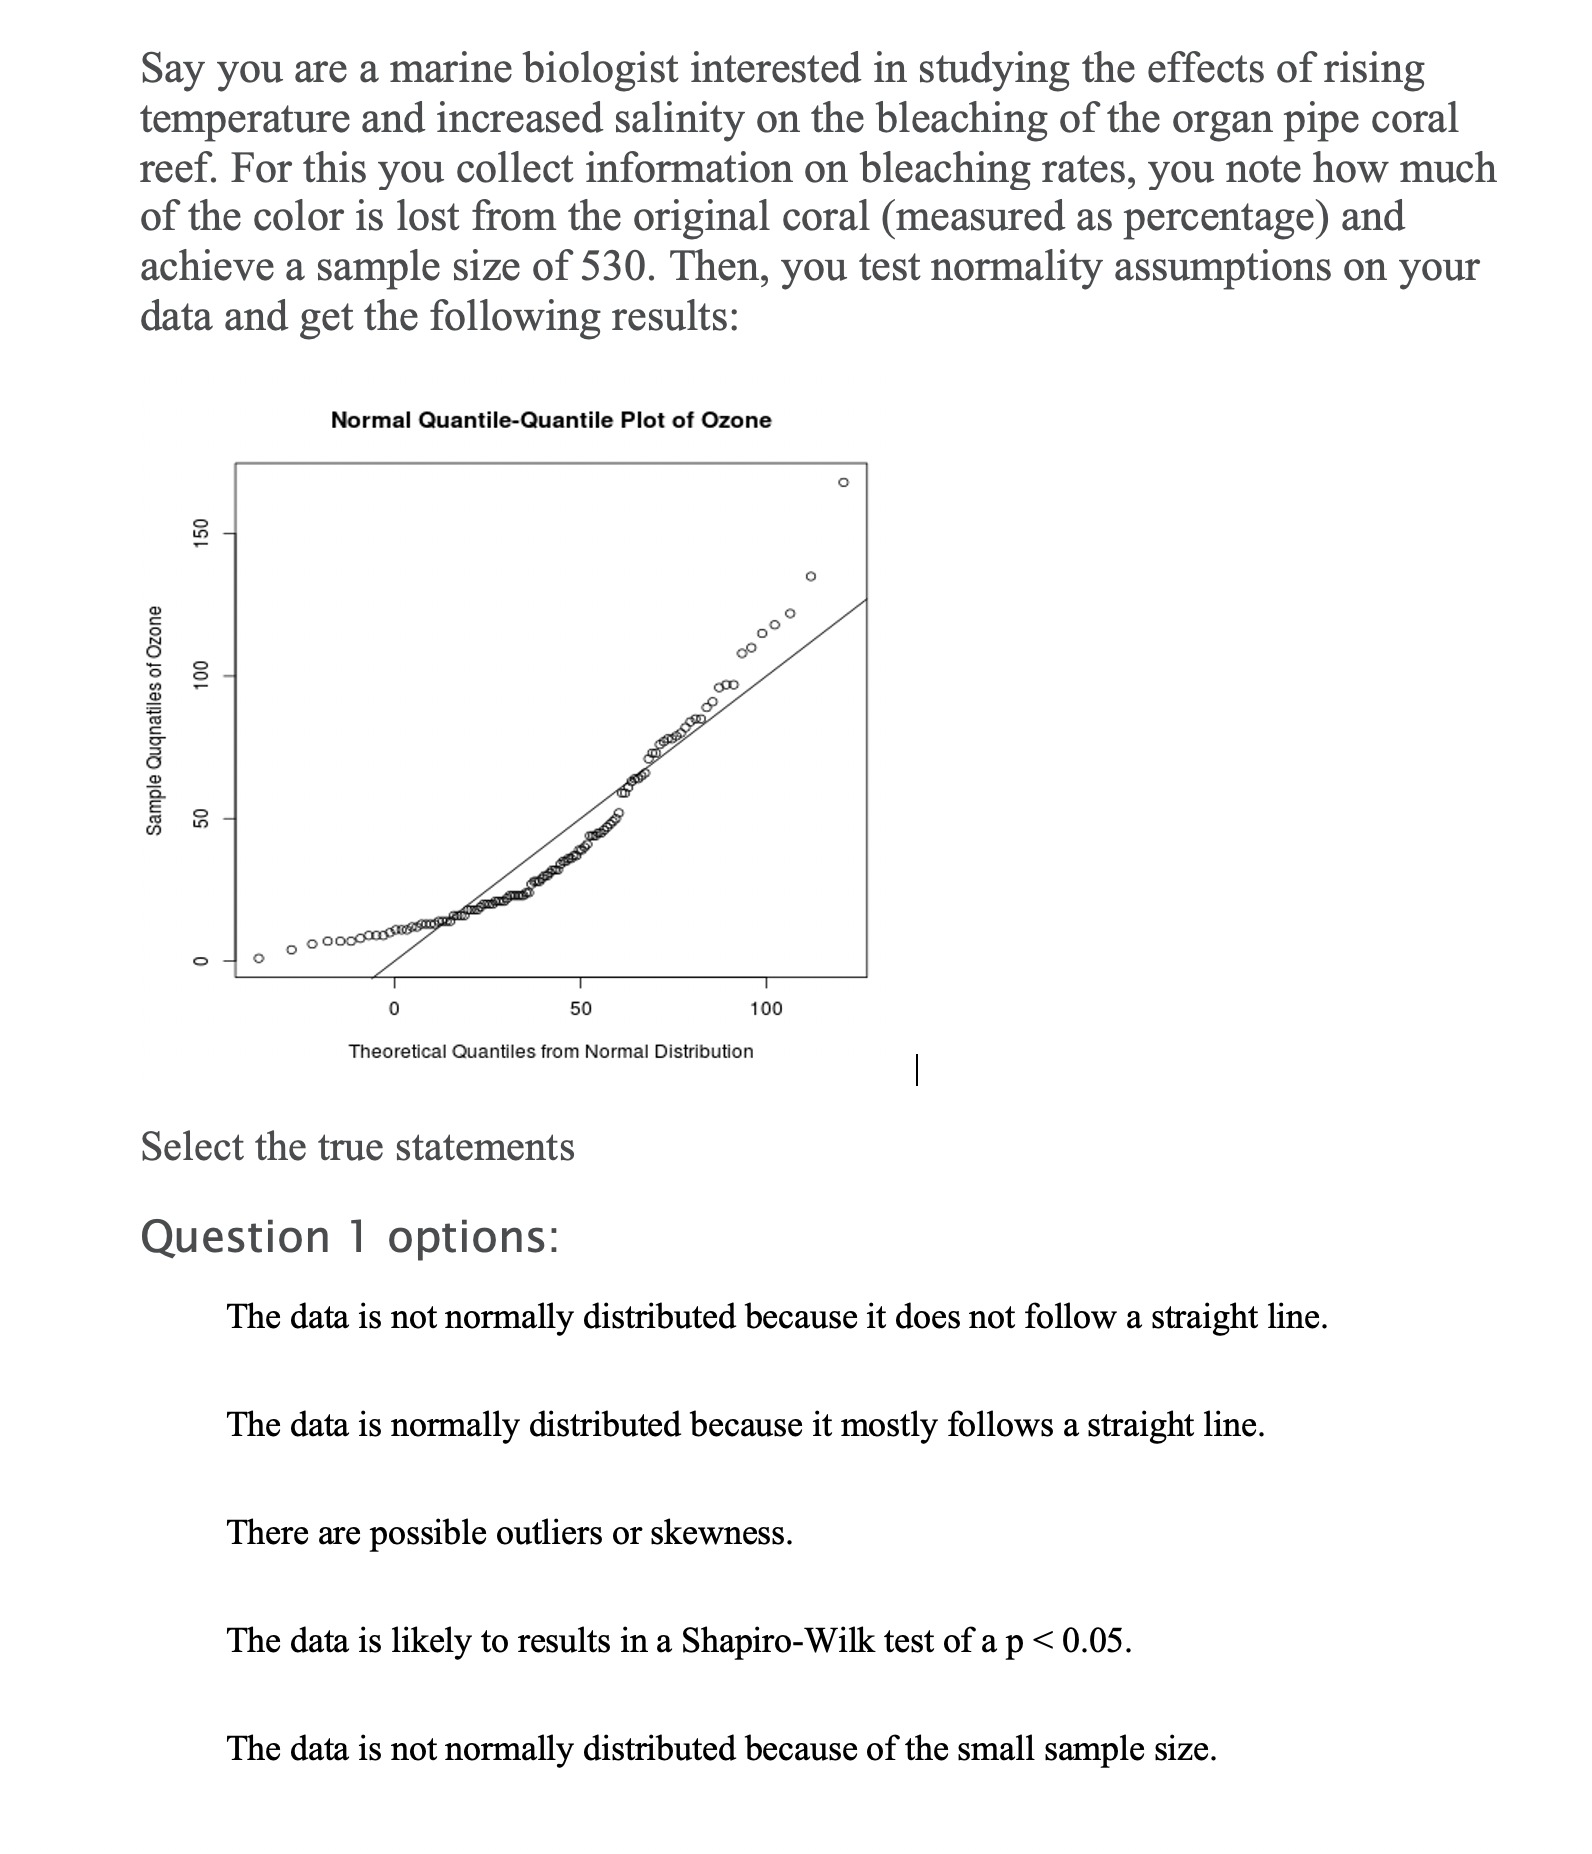
image text in transcribedimage text in transcribedimage text in transcribed
Say you are a marine biologist interested in studying the effects of rising temperature and increased salinity on the bleaching of the organ pipe coral reef. For this you collect information on bleaching rates, you note how much of the color is lost from the original coral (measured as percentage) and achieve a sample size of 530. Then, you test normality assumptions on your data and get the following results: Normal Quantile-Ouantile Plot of Ozone 100 150 Sample Quqnales of Ozone 50 ,,,,,, ....... O 50 1 00 Theoretlcal Quantlles from Normal Distrlbutlon Select the true statements Question 1 options: The data is not normally distributed because it does not follow a straight line. The data is normally distributed because it mostly follows a straight line. There are possible outliers or skewness. The data is likely to results in a Shapiro-Wilk test of a p

Step by Step Solution

There are 3 Steps involved in it

Step: 1

blur-text-image

Get Instant Access to Expert-Tailored Solutions

See step-by-step solutions with expert insights and AI powered tools for academic success

Step: 2

blur-text-image

Step: 3

blur-text-image

Ace Your Homework with AI

Get the answers you need in no time with our AI-driven, step-by-step assistance

Get Started

Recommended Textbook for

High School Math 2012 Common-core Algebra 2 Grade 10/11

Authors: Savvas Learning Co

Student Edition

9780133186024, 0133186024

More Books

Students also viewed these Mathematics questions