Question
All the pictures are attached below: Rat chow is formulated to meet the animals' complete nutritional needs in a way that maintains optimal health. A
All the pictures are attached below:
Rat chow is formulated to meet the animals' complete nutritional needs in a way that maintains optimal health.
A study was designed to compare the weights of rats who had access to rat chow only and those who had access to rat chow and cafeteria food.
Adult male rats who had been raised under identical conditions were randomly assigned to have access to rat chow only or rat chow and access to a variety of foods from the campus cafeteria that were high in fat or sugar for 18 hours a day.
All of the rats could eat as much rat chow as they wanted.
The rats in the group with access to cafeteria food could also eat as much as they wanted during the 18 hours of each day that they had access to the cafeteria food.
After several weeks, the rats' weights were measured.
The investigators hypothesized that the rats with access to cafeteria food would weigh more, on average, than the rats with access only to rat chow.
The way the randomization was done, 15 rats were assigned to have access to art chow and cafeteria food (group chow_cafe) and 19 rats were assigned to rat chow only (group chow_only).
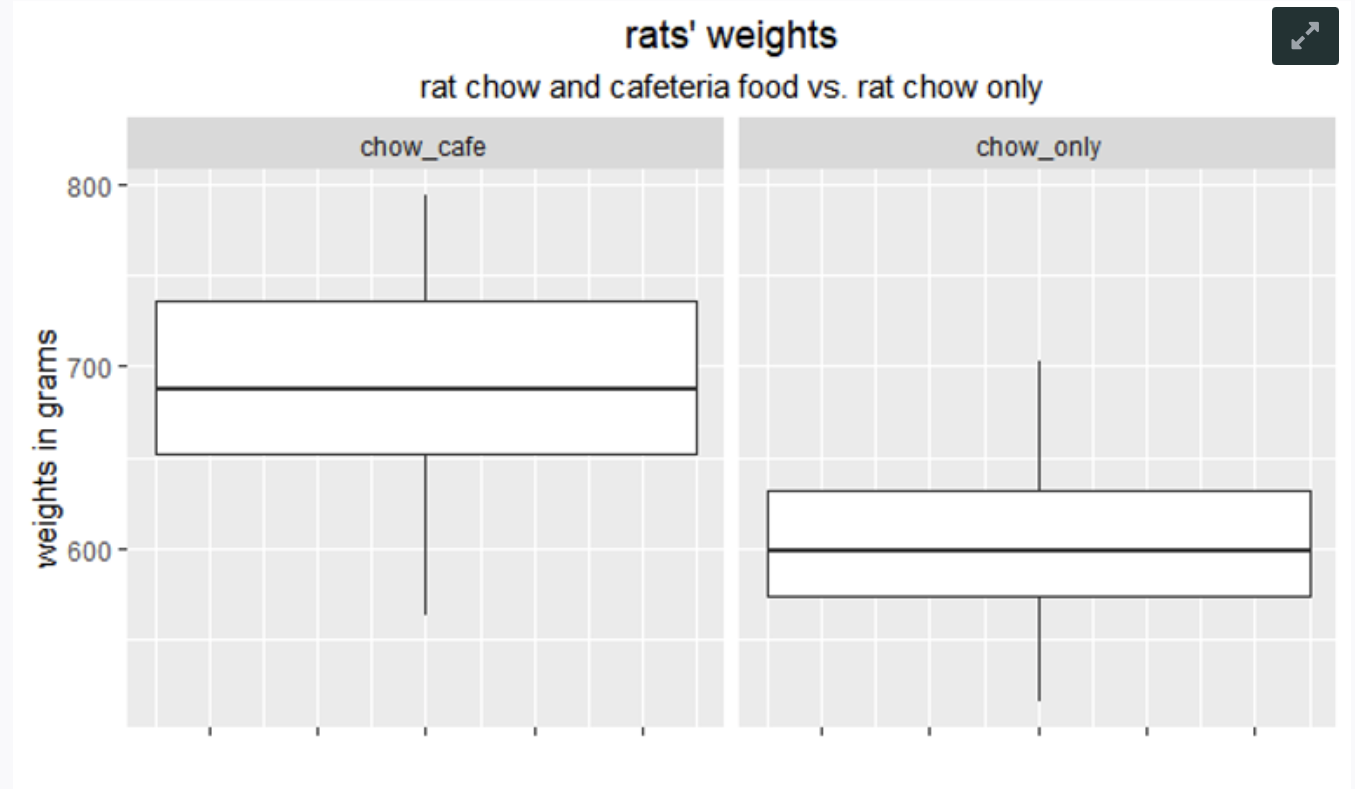
1.1 Based on these box plots, are the distributions of the rats' weights roughly symmetric? please explain.
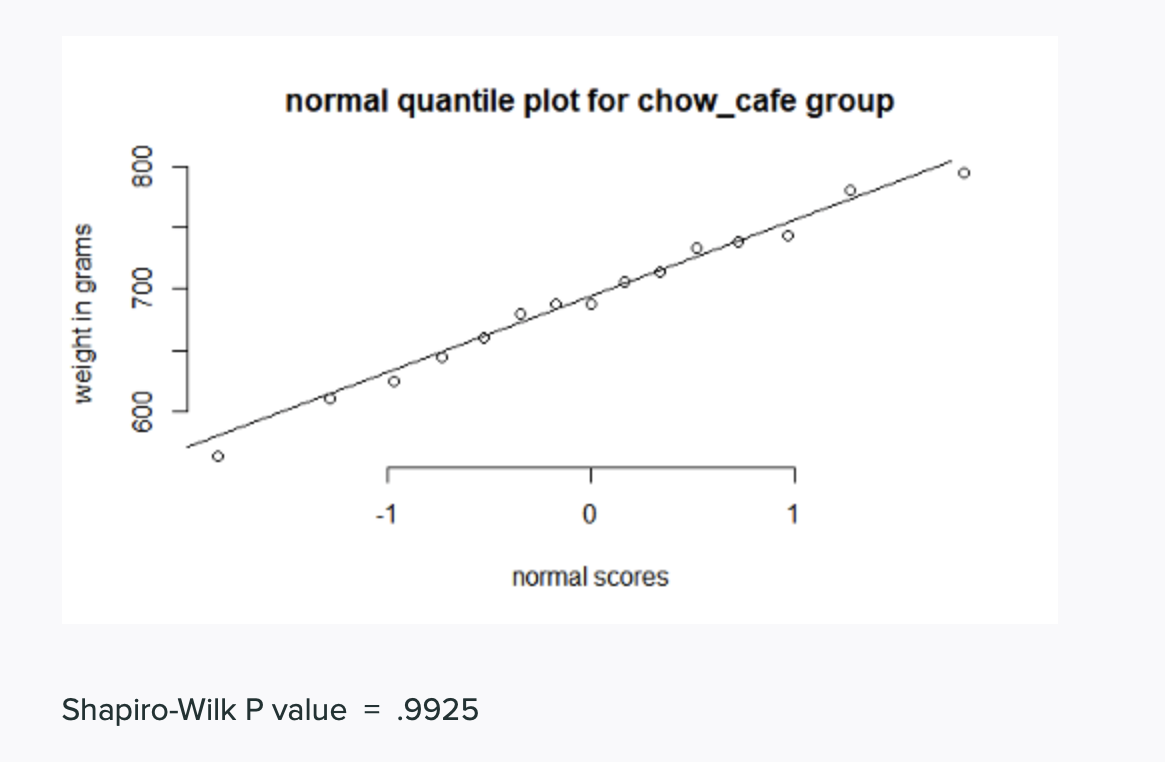
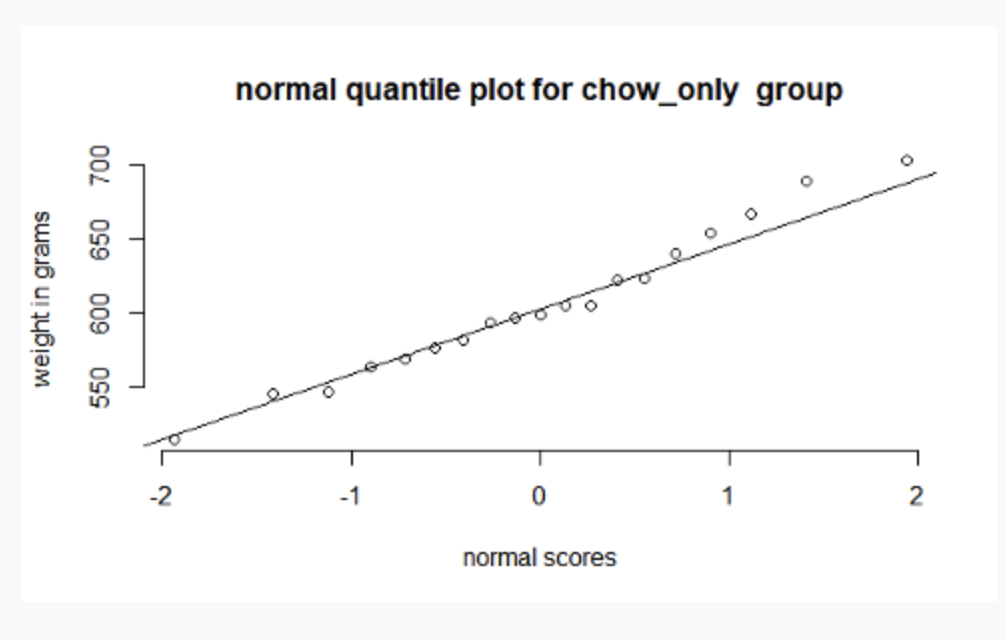
1.2 Here are the normal quantile plots and the Shapiro-Wilk tests for each of the groups:
Shapiro-Wilk P value = .9925
Shapiro-Wilk P value = .9269
Based on the normal quantile plots and the Shapiro Wilk tests, do these data contradict the
assumption that the populations of rats' weights follow normal curves,
at least approximately?
1.3 Based on your answers to questions 3.1 and 3.2, explain why the sampling distribution of x?chow-cafe?x?chow-onlyx is approximately normal
1.4 State the investigators' null and alternative hypotheses.
1.5 Using the summary statistics provided, calculate the estimated standard error of the difference of the sample averages x?chow-cafe?x?chow-onlyx
1.6 Calculate the test statistic. Show intermediate steps.
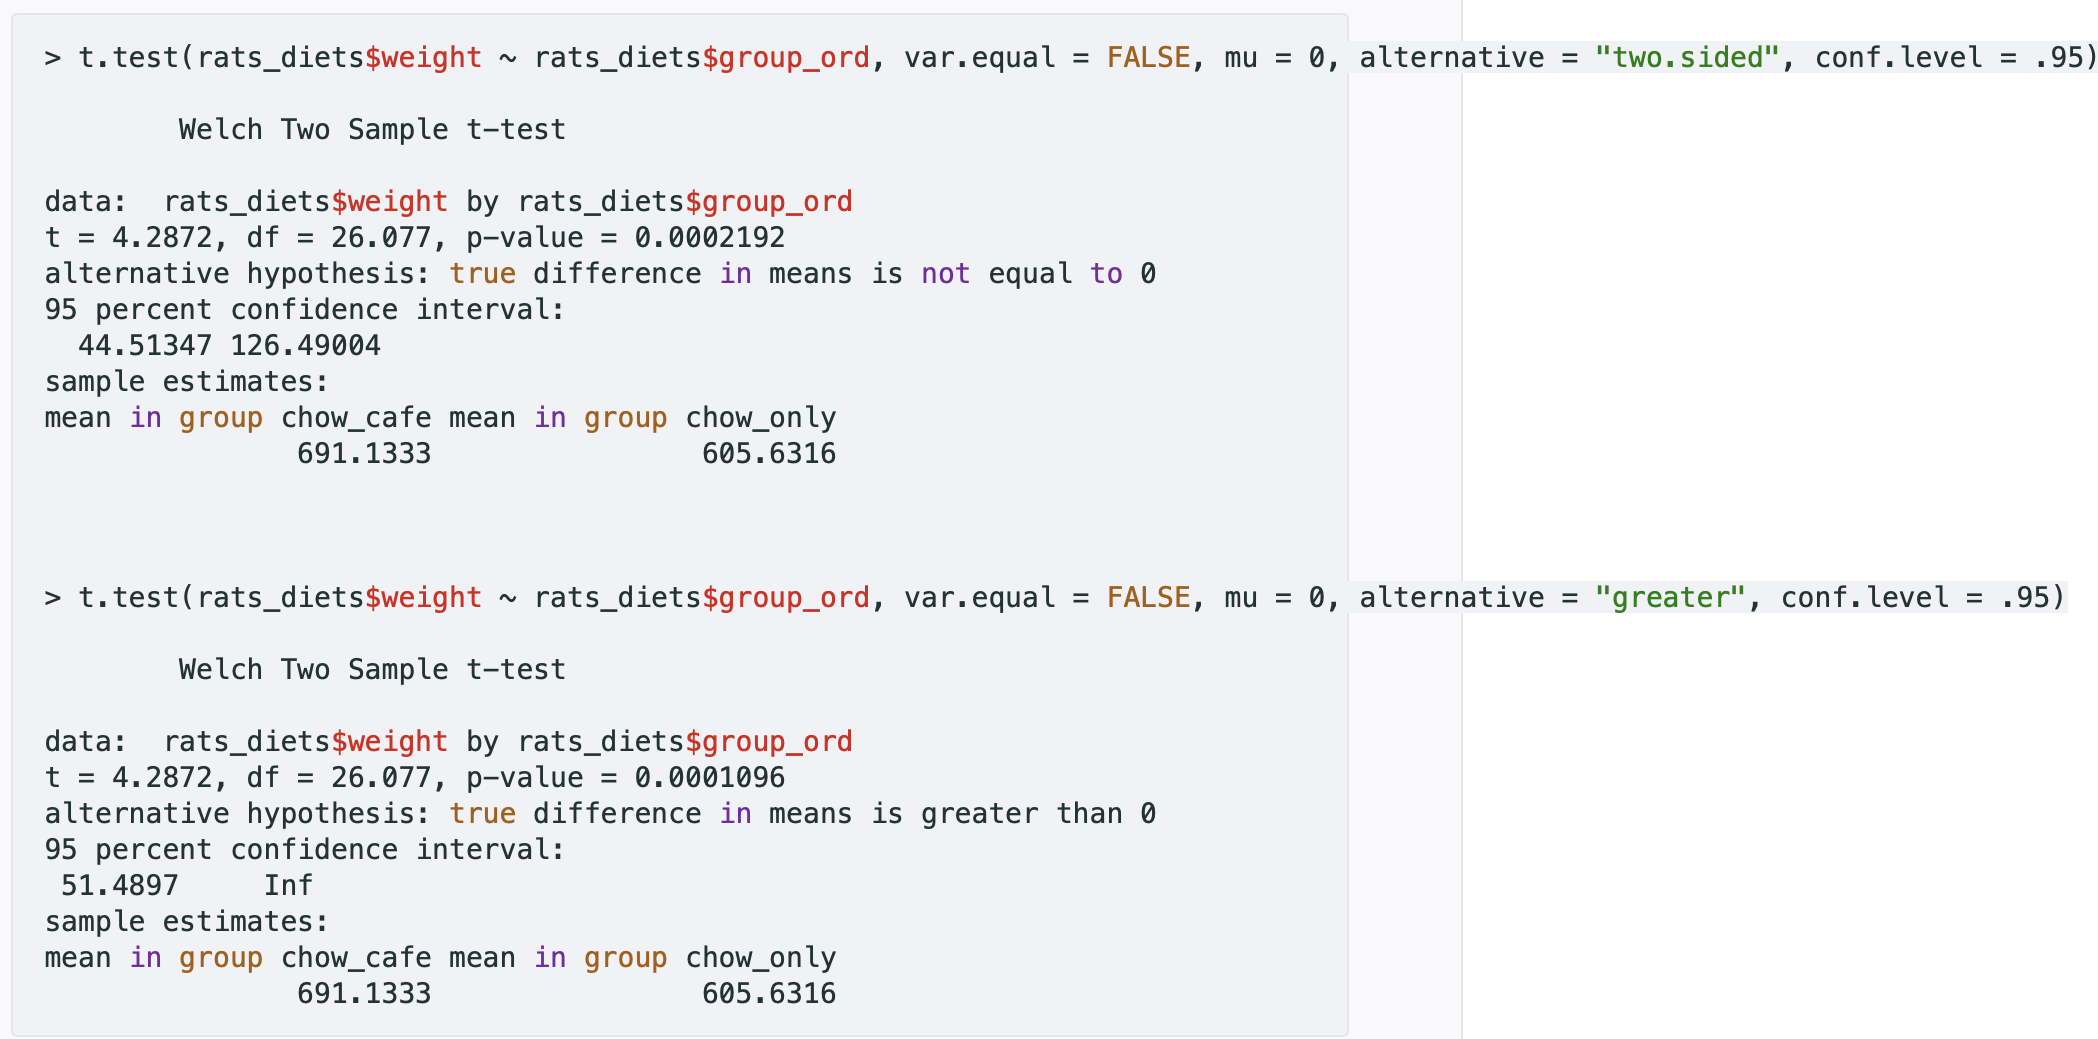
1.7 What is the P value for the investigators' alternative hypothesis?
1.8 Based on the P value, what do you conclude? [Use ?=0.05?=0.05.]
explain in a sentence that clearly communicates the results for a general audience.
1.9 What type of error might the investigators be making?Explain your reasoning
1.10 Do these data support the claim that the difference in the population mean weights could
be as small as 40 g ?


Step by Step Solution
There are 3 Steps involved in it
Step: 1

Get Instant Access to Expert-Tailored Solutions
See step-by-step solutions with expert insights and AI powered tools for academic success
Step: 2

Step: 3

Ace Your Homework with AI
Get the answers you need in no time with our AI-driven, step-by-step assistance
Get Started


