Answered step by step
Verified Expert Solution
Link Copied!

Question

1 Approved Answer

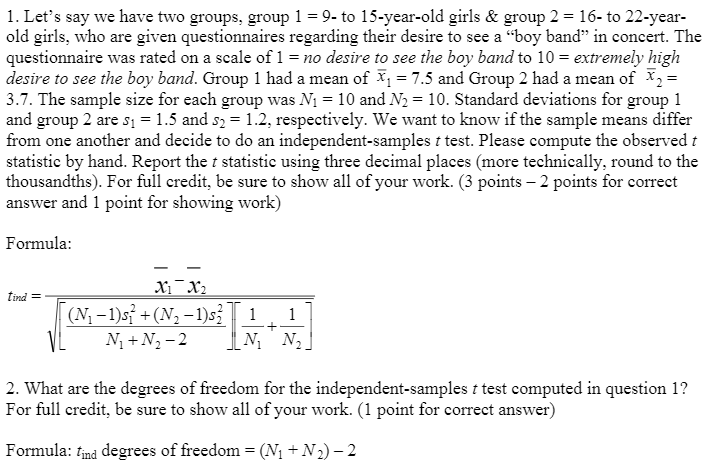
all the question in the picture 1. Let's say we have two groups, group 1 = 9- to 15-year-old girls & group 2 = 16-

all the question in the picture

image text in transcribed
1. Let's say we have two groups, group 1 = 9- to 15-year-old girls & group 2 = 16- to 22-year- old girls, who are given questionnaires regarding their desire to see a "boy band" in concert. The questionnaire was rated on a scale of 1 = no desire to see the boy band to 10 = extremely high desire to see the boy band. Group 1 had a mean of *1 = 7.5 and Group 2 had a mean of X, = 3.7. The sample size for each group was M = 10 and N2 = 10. Standard deviations for group 1 and group 2 are $1 = 1.5 and $2 = 1.2, respectively. We want to know if the sample means differ from one another and decide to do an independent-samples t test. Please compute the observed t statistic by hand. Report the t statistic using three decimal places (more technically, round to the thousandths). For full credit, be sure to show all of your work. (3 points - 2 points for correct answer and 1 point for showing work) Formula: X X2 find = (N] -1)$7 + (N2-1)s; 1 1 Ni+ N2 -2 ILN N2] 2. What are the degrees of freedom for the independent-samples : test computed in question 1? For full credit, be sure to show all of your work. (1 point for correct answer) Formula: find degrees of freedom = (N1 + N2) - 2

Step by Step Solution

There are 3 Steps involved in it

Step: 1

blur-text-image

Get Instant Access to Expert-Tailored Solutions

See step-by-step solutions with expert insights and AI powered tools for academic success

Step: 2

blur-text-image

Step: 3

blur-text-image

Ace Your Homework with AI

Get the answers you need in no time with our AI-driven, step-by-step assistance

Get Started

Recommended Textbook for

Trigonometry, Enhanced

Authors: Cynthia Y Young

4th Edition

1119321131, 9781119321132

More Books

Students also viewed these Mathematics questions