All the three questions are related
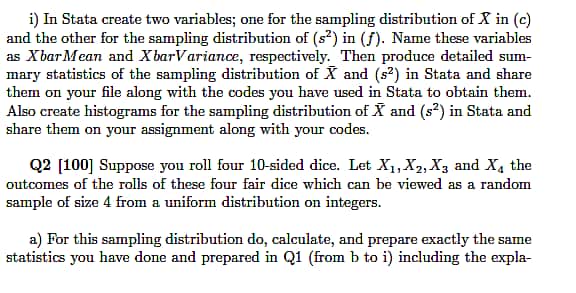
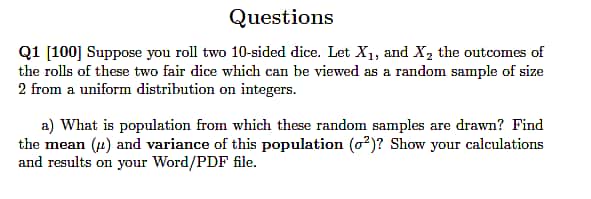
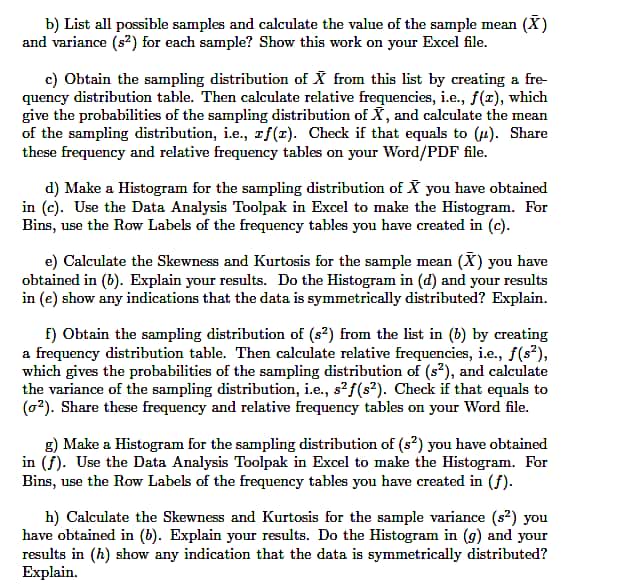
i) In State create two variables; one for the sampling distribution of X in (c) and the other for the sampling distribution of (s ) in (f). Name these variables as XbarMean and XbarVariance, respectively. Then produce detailed sum- mary statistics of the sampling distribution of X and ($2) in State and share them on your file along with the codes you have used in Stata to obtain them. Also create histograms for the sampling distribution of X and (s ) in Stata and share them on your assignment along with your codes. Q2 [100] Suppose you roll four 10-sided dice. Let X], X2, Xy and X, the outcomes of the rolls of these four fair dice which can be viewed as a random sample of size 4 from a uniform distribution on integers. a) For this sampling distribution do, calculate, and prepare exactly the same statistics you have done and prepared in Q1 (from b to i) including the explaQuestions Q1 [100] Suppose you roll two 10-sided dice. Let X], and X, the outcomes of the rolls of these two fair dice which can be viewed as a random sample of size 2 from a uniform distribution on integers. a) What is population from which these random samples are drawn? Find the mean () and variance of this population ( )? Show your calculations and results on your Word/PDF file.b) List all possible samples and calculate the value of the sample mean (X) and variance (s?) for each sample? Show this work on your Excel file. c) Obtain the sampling distribution of X from this list by creating a fre- quency distribution table. Then calculate relative frequencies, i.e., f(x), which give the probabilities of the sampling distribution of X, and calculate the mean of the sampling distribution, i.e., If(r). Check if that equals to (#). Share these frequency and relative frequency tables on your Word/PDF file. d) Make a Histogram for the sampling distribution of X you have obtained in (c). Use the Data Analysis Toolpak in Excel to make the Histogram. For Bins, use the Row Labels of the frequency tables you have created in (c). e) Calculate the Skewness and Kurtosis for the sample mean (X ) you have obtained in (b). Explain your results. Do the Histogram in (d) and your results in (e) show any indications that the data is symmetrically distributed? Explain. F) Obtain the sampling distribution of (s?) from the list in (b) by creating a frequency distribution table. Then calculate relative frequencies, i.e., f(s?), which gives the probabilities of the sampling distribution of (s?), and calculate the variance of the sampling distribution, i.e., s?f(s?). Check if that equals to (0?). Share these frequency and relative frequency tables on your Word file. g) Make a Histogram for the sampling distribution of (s?) you have obtained in (f). Use the Data Analysis Toolpak in Excel to make the Histogram. For Bins, use the Row Labels of the frequency tables you have created in (f). h) Calculate the Skewness and Kurtosis for the sample variance (s?) you have obtained in (b). Explain your results. Do the Histogram in (g) and your results in (h) show any indication that the data is symmetrically distributed? Explain.nations, tables and histograms. Q3 [50] How do you explain the differences in the results you have obtained in Q1 and Q27 What does the Central Limit Theorem tell us regarding these differences? Use appropriate relevant statistics to support your answer and to explain in detail what the Central Limit Theorem predicts for our sampling dis- tribution? What should we expect to happen if we roll, say 100 or 1000 10-sided dice


