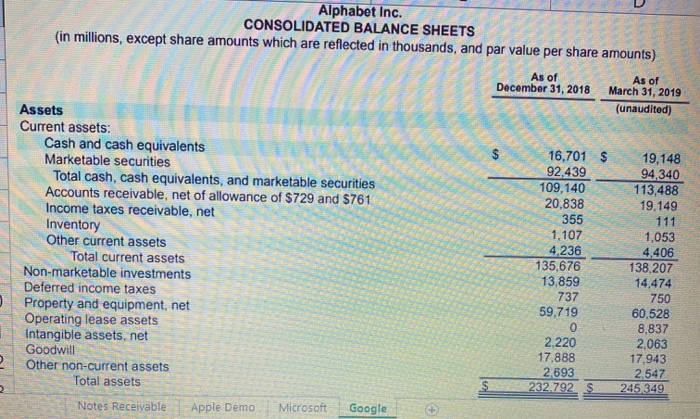
Alphabet Inc. CONSOLIDATED BALANCE SHEETS (in millions, except share amounts which are reflected in thousands, and par value per share amounts) As of December 31, 2018 As of March 31, 2019 (unaudited) $ Assets Current assets: Cash and cash equivalents Marketable securities Total cash, cash equivalents, and marketable securities Accounts receivable, net of allowance of $729 and $761 Income taxes receivable, net Inventory Other current assets Total current assets Non-marketable investments Deferred income taxes Property and equipment, net Operating lease assets Intangible assets, net Goodwill Other non-current assets Total assets Notes Receivable Apple Demo Microsoft Google 16,701 $ 92,439 109,140 20,838 355 1,107 4,236 135,676 13.859 737 59,719 0 2.220 17.888 2,693 232.792 19,148 94,340 113,488 19.149 111 1,053 4,406 138,207 14,474 750 60,528 8,837 2.063 17.943 2.547 245 349 10 2 10 insert Page Layout Formulas Data Review View Help Calibri - 12 - A GA- Wrap Text General BIU- Merge & Center $ % & board Condition Formatting Font Alignment Number C 17,888 2,693 232.792 $ D 17,943 2,547 245 349 $ A B Goodwill Other non-current assets Total assets Liabilities and Stockholders' Equity Current liabilities: Accounts payable Accrued compensation and benefits Accrued expenses and other current liabilities Accrued revenue share Deferred revenue Income taxes payable, net Total current liabilities Long-term debt Deferred revenue, non-current Income taxes payable, non-current Deferred income taxes Operating lease liabilities Other long-term liabilities Total liabilities 4,378 $ 6,839 16,958 4,592 1,784 69 34,620 4,012 396 11,327 1,264 0 3,545 55,164 3,710 5,072 19,382 4,318 1,667 761 34,910 4.066 391 11.605 1,282 8.206 1.417 61 877 Alphabet Inc. CONSOLIDATED STATEMENTS OF INCOME Notes Receivalta Anne Dom B C D A Income taxes payable, non-current Deferred income taxes Operating lease liabilities Other long-term liabilities Total liabilities 11,327 1,264 0 3,545 55,164 11,605 1,282 8,206 1,417 61 877 Alphabet Inc. CONSOLIDATED STATEMENTS OF INCOME (In millions, except per share amounts) Year Ended December 31, 2017 2018 2019 $ 110,855 $ 136,819 $ 161,857 Revenues Benchmark Quick Ratio= Cash+ST investments+Net AR Current liabilities = #DIV/0! >1 Days Sales in Receivables Avg Net AR Net Sales/365 days = #DIV/0! How's Google's performance compared to Microsoft and Apple