

Answered step by step
Verified Expert Solution
Question
1 Approved Answer
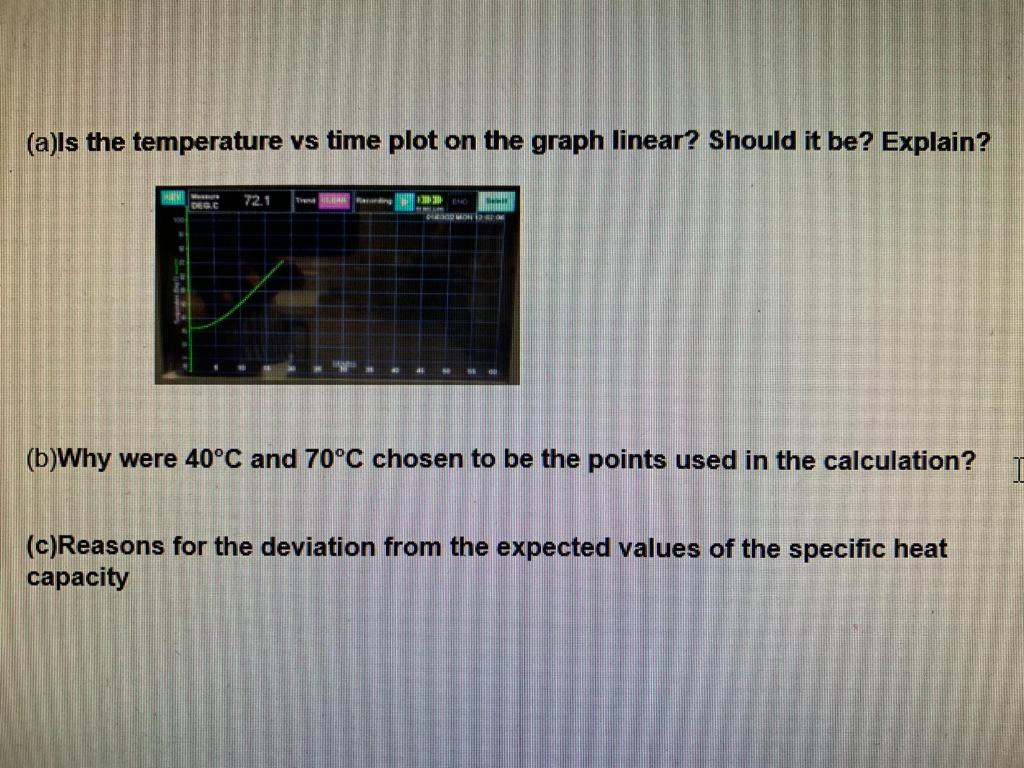
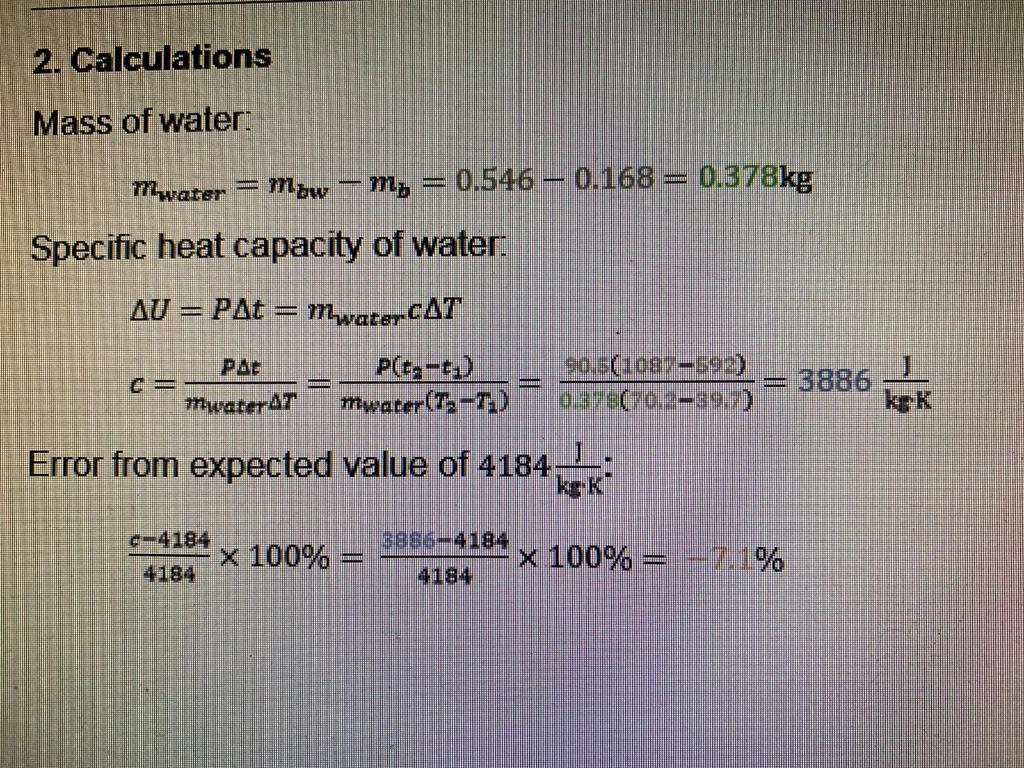
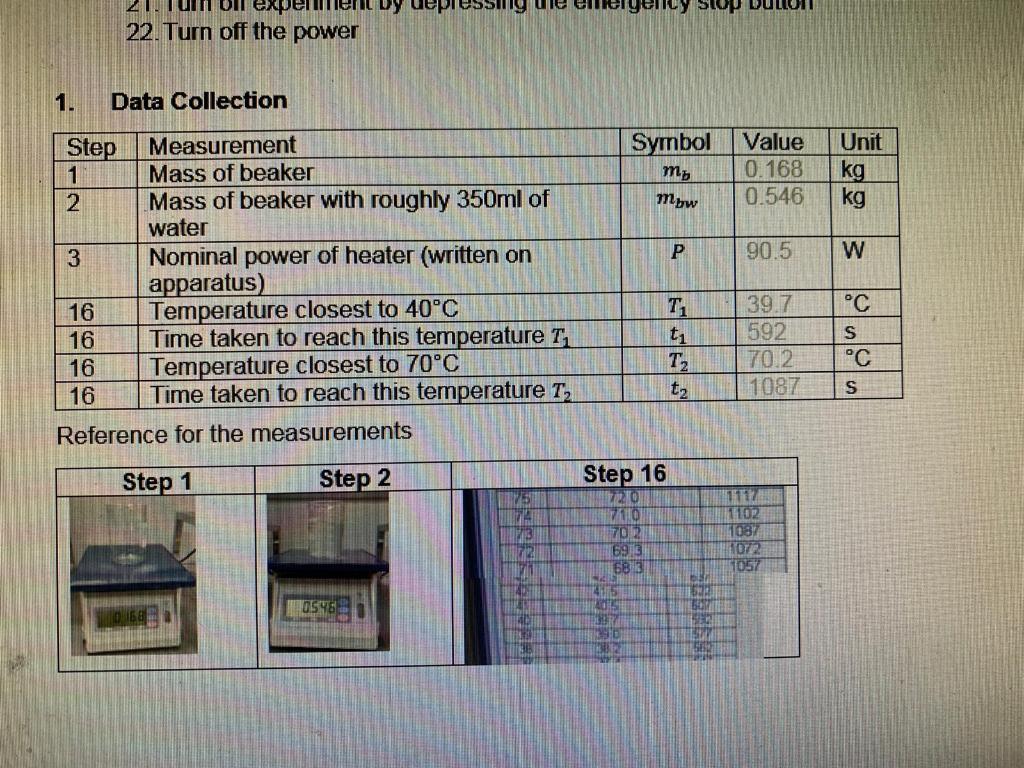
(a)ls the temperature vs time plot on the graph linear? Should it be? Explain? 72.1 Trend IN DESC 20 (b)Why were 40C and 70C chosen
Step by Step Solution
There are 3 Steps involved in it
Step: 1

Get Instant Access to Expert-Tailored Solutions
See step-by-step solutions with expert insights and AI powered tools for academic success
Step: 2

Step: 3
Ace Your Homework with AI
Get the answers you need in no time with our AI-driven, step-by-step assistance
Get Started
Data Driven Fluid Mechanics Combining First Principles And Machine Learning
Authors: Miguel A. Mendez, Andrea Ianiro, Bernd R. Noack, Steven L. Brunton
1st Edition
1108842143, 9781108842143