Also using the spreadsheet, prepare the following for the most recent two years:
- Comparative Income Statement - Vertical Analysis (Illustration 13-12 in Section 13.2 Comparative Analysis on WileyPlus or see page 658 for example)
- Comparative Balance Sheet - Horizontal Analysis (Illustration 13-9 in Section 13.2 Comparative Analysis on WileyPlus or see page 656 for example)
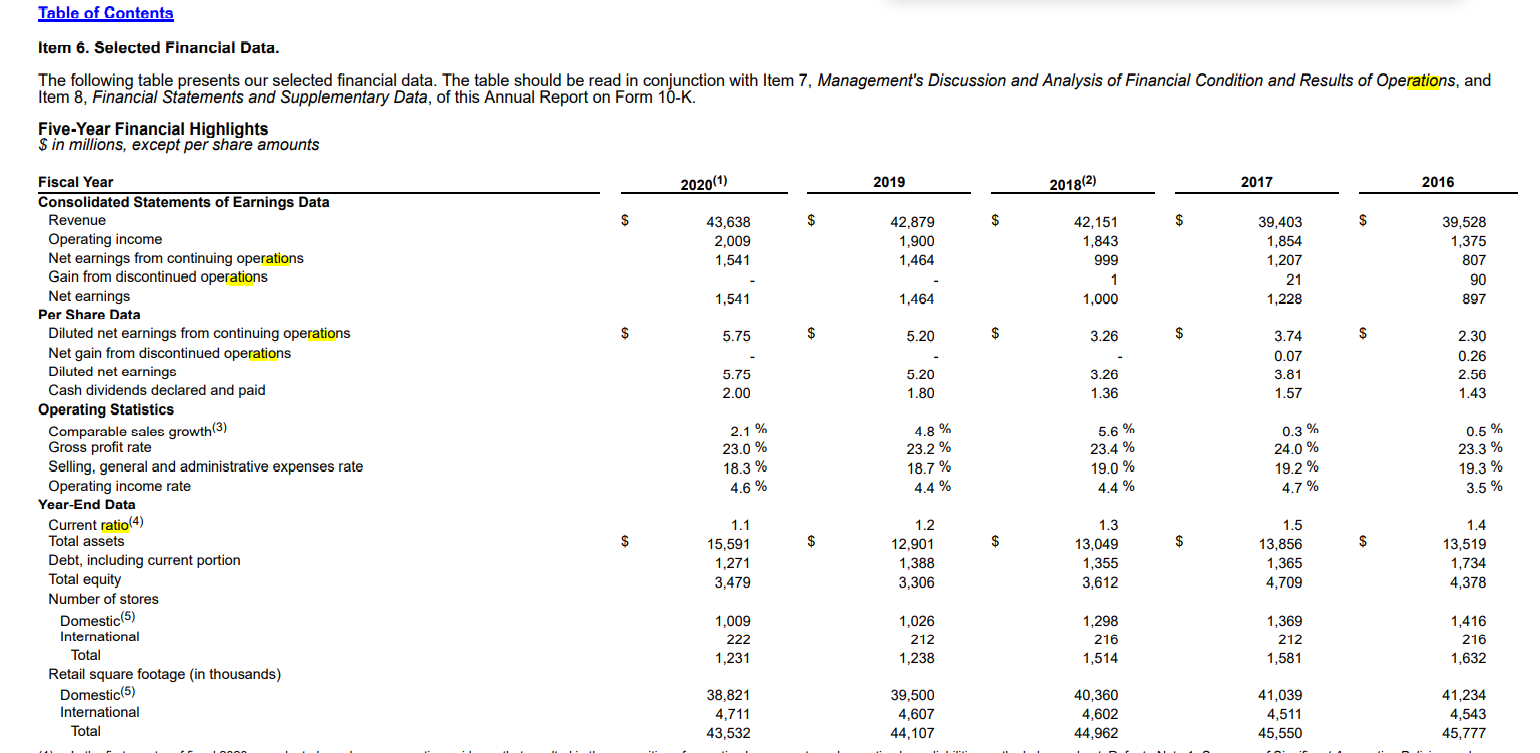
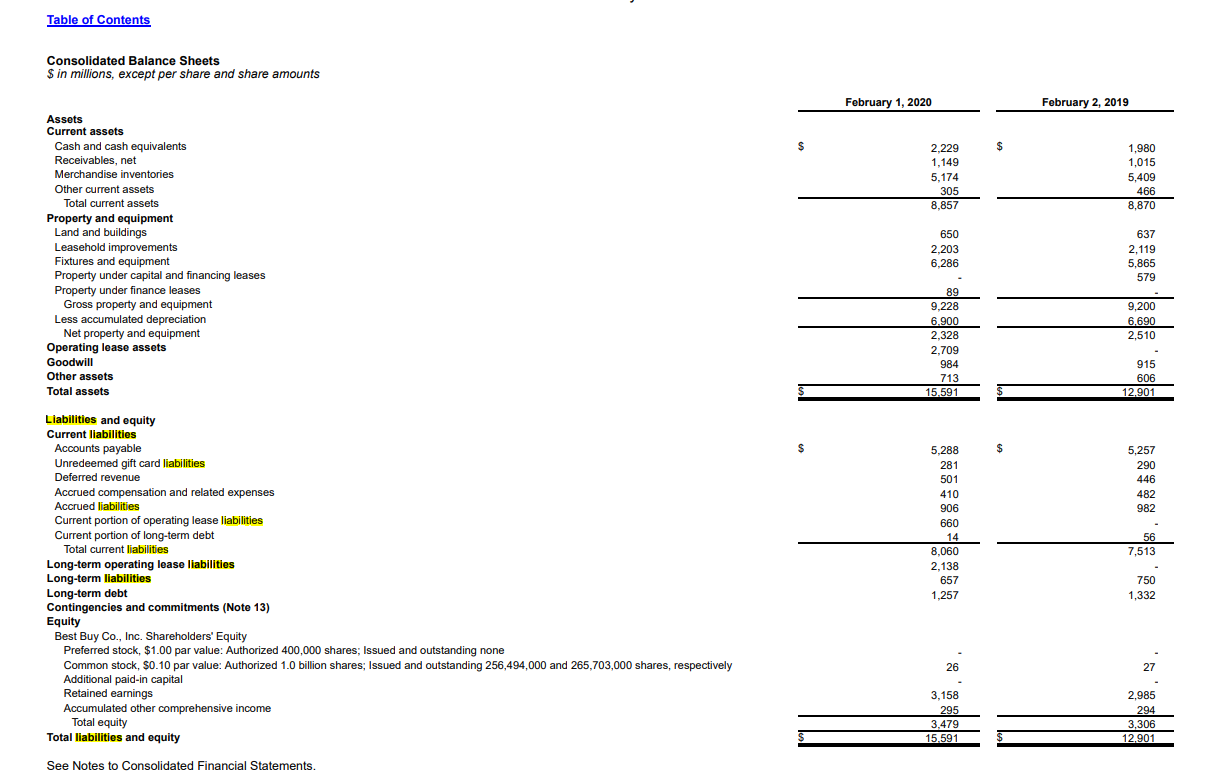
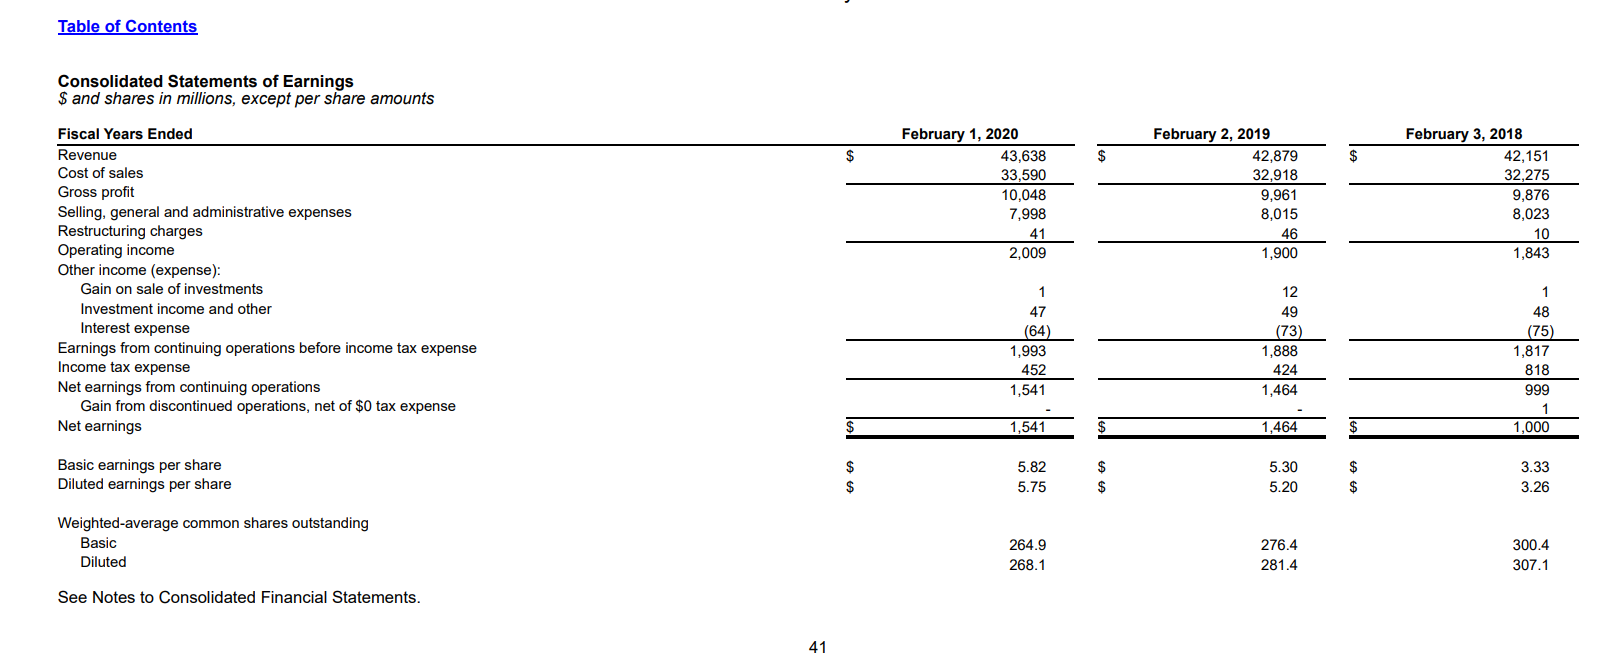
Table of Contents Item 6. Selected Financial Data. The following table presents our selected financial data. The table should be read in conjunction with Item 7, Management's Discussion and Analysis of Financial Condition and Results of Operations, and Item 8, Financial Statements and Supplementary Data, of this Annual Report on Form 10-K. Five-Year Financial Highlights $ in millions, except per share amounts 2020(1) 2019 2018(2) 2017 2016 $ $ $ $ $ 43,638 2,009 1,541 42,879 1,900 1,464 42,151 1,843 999 1 1,000 39,403 1,854 1,207 21 1,228 39,528 1,375 807 90 897 1,541 1,464 $ 5.75 $ 5.20 $ 3.26 $ 3.74 $ 2.30 0.26 2.56 1.43 5.75 2.00 5.20 1.80 0.07 3.81 1.57 3.26 1.36 Fiscal Year Consolidated Statements of Earnings Data Revenue Operating income Net earnings from continuing operations Gain from discontinued operations Net earnings Per Share Data Diluted net earnings from continuing operations Net gain from discontinued operations Diluted net earnings Cash dividends declared and paid Operating Statistics Comparable sales growth(3) Gross profit rate Selling, general and administrative expenses rate Operating income rate Year-End Data Current ratio(4) Total assets Debt, including current portion Total equity Number of stores Domestic(5) International Total Retail square footage (in thousands) Domestic(5) International Total 2.1 % 23.0 % 18.3 % 4.6 % 4.8 % 23.2 % 18.7 % 4.4 % 5.6 % 23.4 % 19.0 % 4.4 % 0.3 % 24.0 % 19.2% 4.7 % 0.5 % 23.3 % 19.3 % 3.5 % $ $ $ 1.1 15,591 1,271 3,479 1.2 12,901 1,388 3,306 1.3 13,049 1,355 3,612 1.5 13,856 1,365 4,709 1.4 13,519 1,734 4,378 1,009 222 1,231 1,026 212 1.238 1,298 216 1,514 1,369 212 1,581 1,416 216 1,632 38,821 4,711 43,532 39,500 4,607 44,107 40,360 4,602 44,962 41,039 4,511 45,550 41,234 4,543 45,777 Table of Contents Consolidated Balance Sheets $ in millions, except per share and share amounts February 1, 2020 February 2, 2019 $ $ 2.229 1,149 5,174 305 8,857 1,980 1,015 5,409 466 8,870 Assets Current assets Cash and cash equivalents Receivables, net Merchandise inventories Other current assets Total current assets Property and equipment Land and buildings Leasehold improvements Fixtures and equipment Property under capital and financing leases Property under finance leases Gross property and equipment Less accumulated depreciation Net property and equipment Operating lease assets Goodwill Other assets Total assets 650 2,203 6,286 637 2,119 5,865 579 9,200 6.690 2,510 89 9.228 6.900 2.328 2.709 984 713 15,591 915 606 12.901 5,257 290 446 482 982 Liabilities and equity Current liabilities Accounts payable Unredeemed gift card liabilities Deferred revenue Accrued compensation and related expenses Accrued liabilities Current portion of operating lease liabilities Current portion of long-term debt Total current liabilities Long-term operating lease liabilities Long-term liabilities Long-term debt Contingencies and commitments (Note 13) Equity Best Buy Co., Inc. Shareholders' Equity Preferred stock, $1.00 par value: Authorized 400,000 shares; Issued and outstanding none Common stock, $0.10 par value: Authorized 1.0 billion shares; Issued and outstanding 256,494,000 and 265,703,000 shares, respectively Additional paid-in capital Retained earnings Accumulated other comprehensive income Total equity Total liabilities and equity 5,288 281 501 410 906 660 14 8,060 2,138 657 1,257 56 7,513 750 1,332 26 27 3,158 295 3,479 15.591 2,985 294 3,306 12.901 See Notes to Consolidated Financial Statements. Table of Contents Consolidated Statements of Earnings $ and shares in millions, except per share amounts $ $ $ February 1, 2020 43,638 33,590 10,048 7,998 41 2,009 February 2, 2019 42,879 32,918 9,961 8,015 46 1,900 February 3, 2018 42,151 32,275 9,876 8,023 10 1,843 Fiscal Years Ended Revenue Cost of sales Gross profit Selling, general and administrative expenses Restructuring charges Operating income Other income (expense): Gain on sale of investments Investment income and other Interest expense Earnings from continuing operations before income tax expense Income tax expense Net earnings from continuing operations Gain from discontinued operations, net of $0 tax expense Net earnings 1 47 (64) 1,993 452 1,541 12 49 (73) 1,888 424 1,464 1 48 (75) 1,817 818 999 1 1,000 $ 1,541 1,464 $ Basic earnings per share Diluted earnings per share $ $ 5.82 5.75 $ $ 5.30 5.20 3.33 3.26 $ Weighted average common shares outstanding Basic Diluted 264.9 268.1 276.4 281.4 300.4 307.1 See Notes to Consolidated Financial Statements. 41